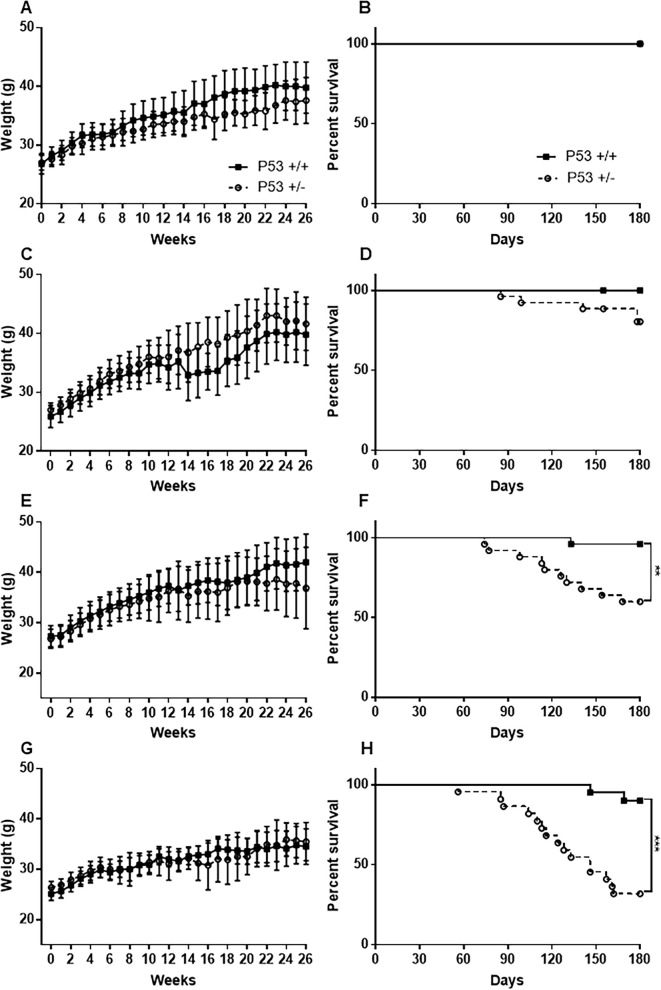
Fig 1. Body weight change and survival rate after MNU administration in different dosages.
Body weight change of the 0 (untreated control; A), 25mg/kg (C), 50mg/kg (E), and 75mg/kg (G) group; survival rate of the 0 (B), 25mg/kg (D), 50mg/kg (F), and 75mg/kg (H) group. Data are represented as mean ± SD. **P < 0.01 and ***P < 0.001 versus wild-type mice, as assessed using Long-rank test.

