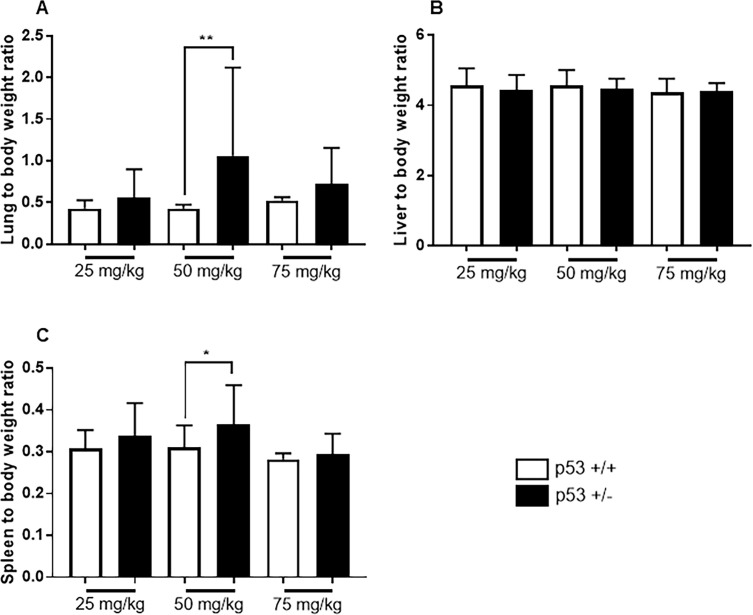
Fig 2. Relative organ weights after MNU administration in different dosages.
(A) shows lung to body weight ratio, (B) shows liver to body weight ratio, and (C) shows spleen to body weight ratio in the mice survived until the end of the experiment. Data are represented as mean ± SD. *P < 0.05 and **P < 0.01 versus wild type mice, as assessed using two-tailed t-test.

