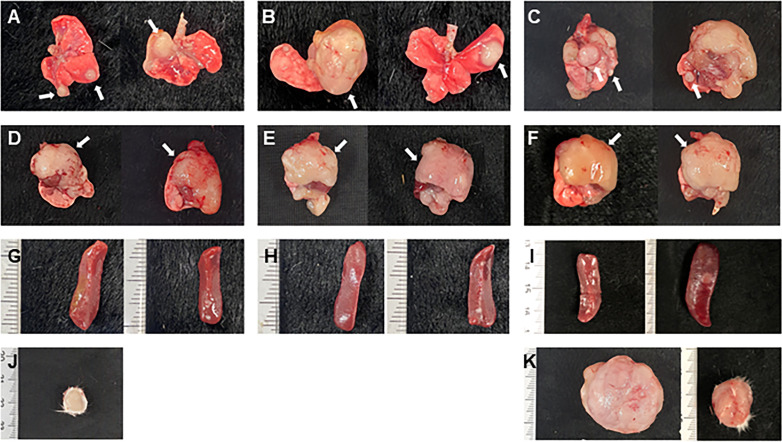
Fig 3. Representative images of gross lesions after MNU administration in different dosages.
Macroscopic appearance of large mass (white arrows) in the lungs (A, B, C), and thymus (D, E, F) shown in FVB-p53+/- mice of the 25mg/kg (A, D), 50mg/kg (B, E), and 75mg/kg (C, F) group. Splenomegaly (G, H, I) and a large subcutaneous mass (J, K) shown in the FVB-p53+/- mice of the 25mg/kg (G, J), 50mg/kg (H), and 75mg/kg (I, K) group.

