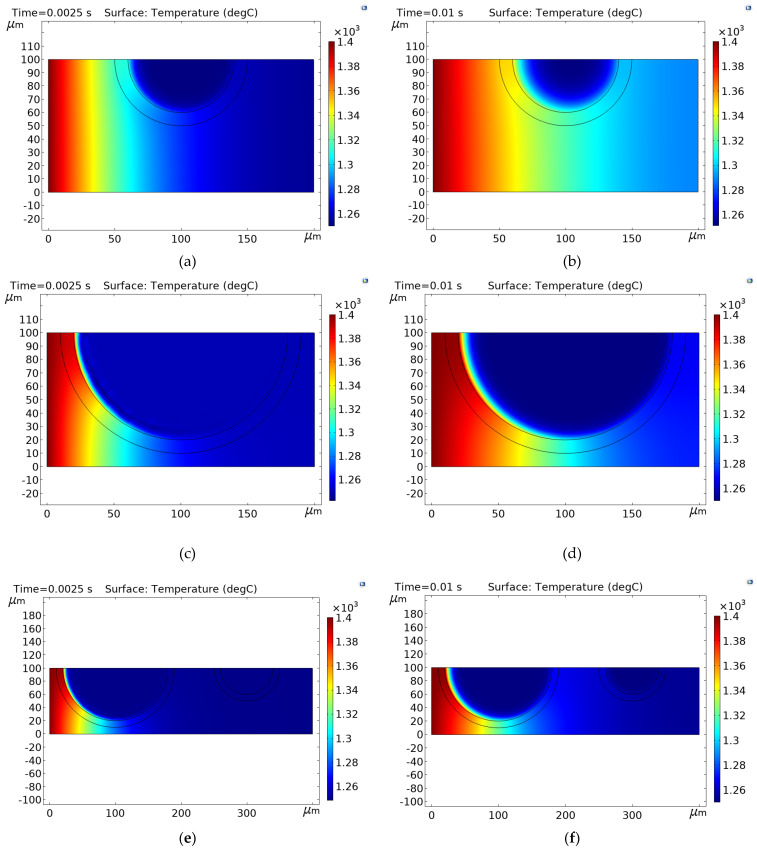
Figure 8.
Graphical distribution of the temperature magnitudes in: (a) Composite 1 over x-z plane at time instant ; (b) Composite 1 over x-z plane at time instant ; (c) Composite 2 over x-z plane at time instant ; (d) Composite 2 over x-z plane at time instant ; (e) Composite 3 over x-z plane at time instant ; (f) Composite 3 over x-z plane at time instant .

