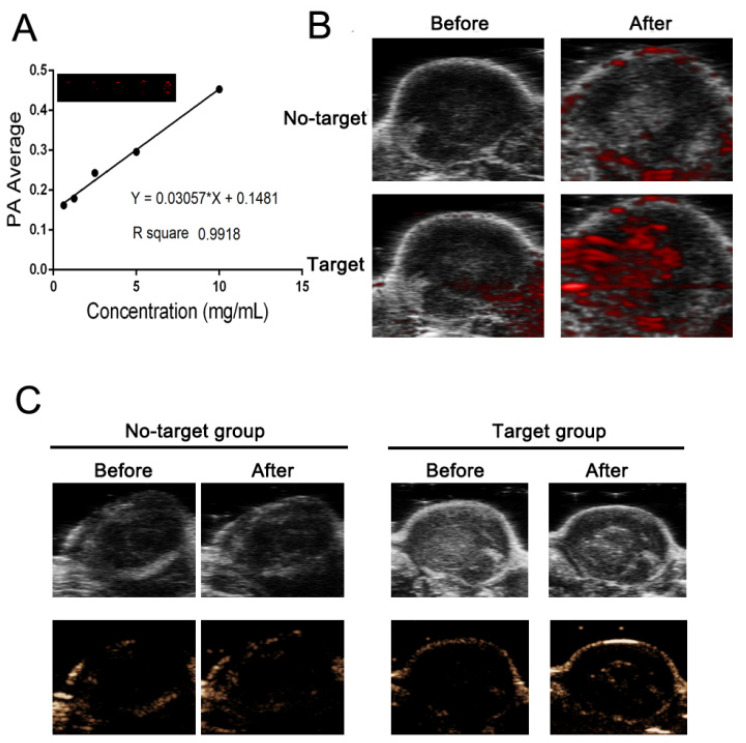
Figure 5.
PA and ultrasound imaging in vivo: (A) Quantitative analysis of the relationship between the PA signal intensity and the nanoparticle concentration. (B) PA images of the tumor before and after nanoparticle injection. (C) US images in B-mode and CEUS mode of nanoparticles before and after LIFU irradiation.

