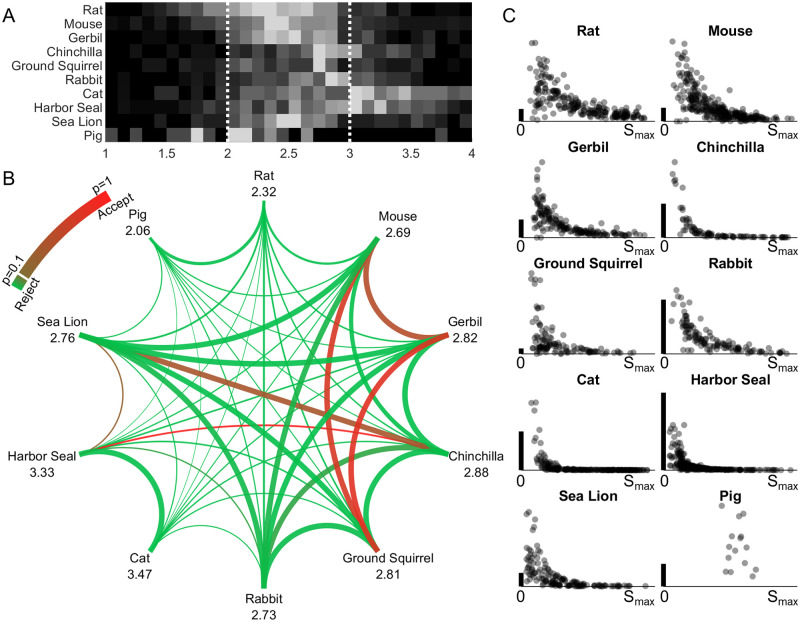
Fig 4. A fractional exponent model can be used to quantify whisker curvature.
(A) A heatmap of exponent (β) values for whiskers of all species is shown. (B) This graph shows results of a cross-species comparison generated from the unpaired t-tests in step 2. The number under each species name is the generalized fractional exponent β value determined in step 3 (optimized across all whiskers for that species), and the thickness of each line connecting two species represents the difference in magnitude of the two β values, with thicker lines indicating more similar values. The color of the curve indicates the p-value of the student’s unpaired t-test. The green color rejects the null hypothesis, indicating that whiskers can be distinguished, while the red color accepts the null hypothesis, indicating that whiskers cannot be distinguished. (C) For each species, the coefficients aβ are plotted as a function of whisker arc length (Smax). The values of aβ are highly variable for short whiskers compared to long whiskers. In all plots the vertical scale bar (heavy black vertical line) represents 0.005mm1-β Each point is transparent gray so darker colors indicate a greater density of points.

