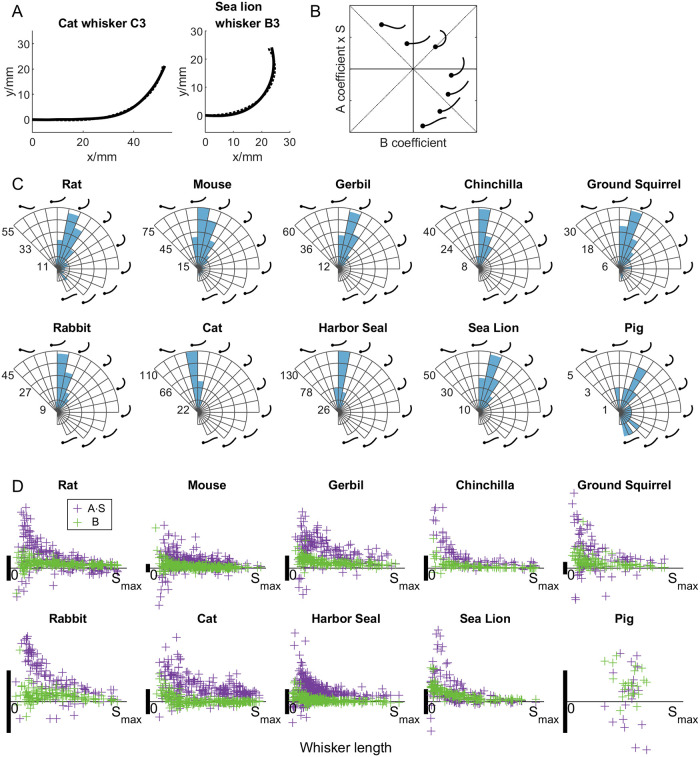
Fig 6. Whiskers can be fit to Cesàro curves.
(A) Two exemplar whiskers fit to Cesàro equations are shown for cat and sea lion. Solid curve: Whisker. Dotted curve: Fit curve. (B) In the present dataset, whiskers could be classified into 9 different shapes, 7 of which are illustrated in the (B, A∙S) coefficient space (two are omitted in the first quadrant for visual clarity). The dots indicate the base of the schematized whiskers. (C) Polar histograms indicate the total number of whiskers in each region of the coefficient space for each species. The coordinates in each panel are the same as in (B). The radial axis indicates the number of whiskers. (D) The two coefficients B and A∙S show large variance for short whiskers compared to long whiskers. In all plots the vertical scale bar (heavy black vertical line) represents 0.05mm.

