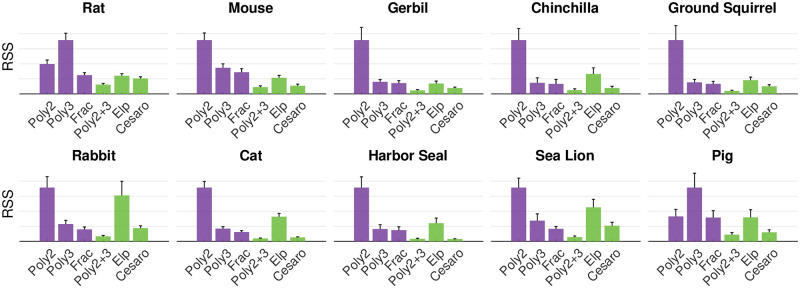
Fig 8. RSS is compared for all models for all species.
In each subplot, the y-axis is normalized to the maximum value. All plots show adjusted RSS to account for differences in the number of parameters (either one or two). Poly2: y = a2x2. Poly3: y = a3x3. Poly2+3: y = a3x3+a2x2. Frac: Fractional exponent model. Elp: Elliptical model.

