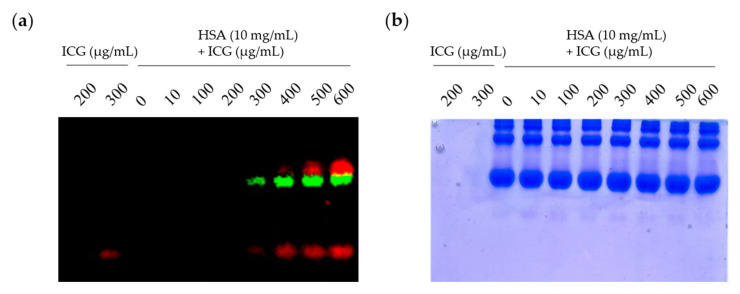
Figure 1.
Binding ICG to HSA (a) Optical imaging of ICG and ICG-HSA complex. Saturation binding analysis using Native PAGE gel electrophoresis in a mixture of HSA and ICG at various concentrations. After the fluorescence signal was unmixed by Lumina II Imaging System, the ICG-HSA complex was presented as green, and the unbound ICG was presented as red; (b) image of Native PAGE gel after Coomassie blue staining.

