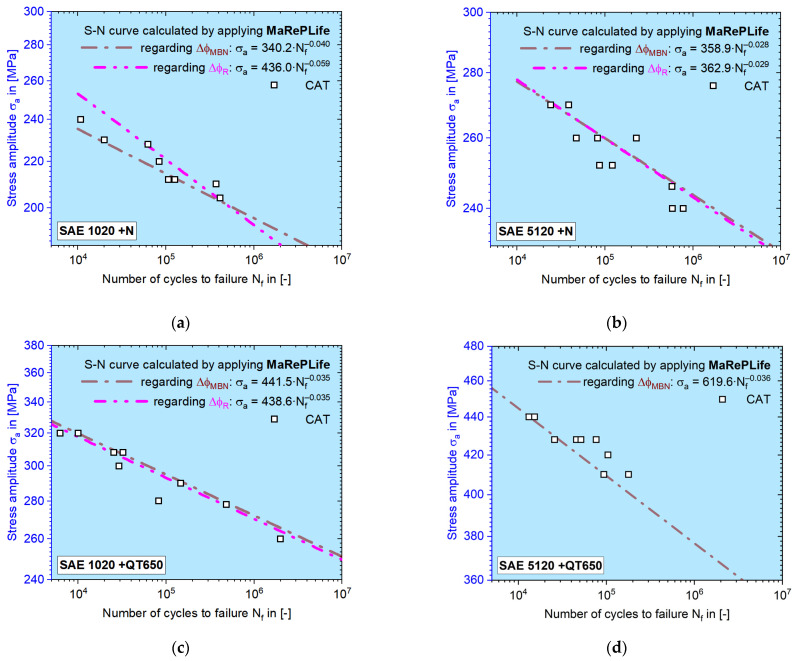
Figure 16.
Calculated S–N curves using MaRePLife for (a) SAE 1020 normalized; (b) SAE 5120 normalized; (c) SAE 1020 quenched and tempered at 650 °C; (d) SAE 5120 quenched and tempered at 650 °C. The magenta dash-dot-dot-dash line is the S–N curve calculated by applying a change in the electrical resistance ratio, ΔφR. The brown dash-dot-dash line represents the S–N curve calculated by applying a change in the MBN signal ratio, ΔφMBN.

