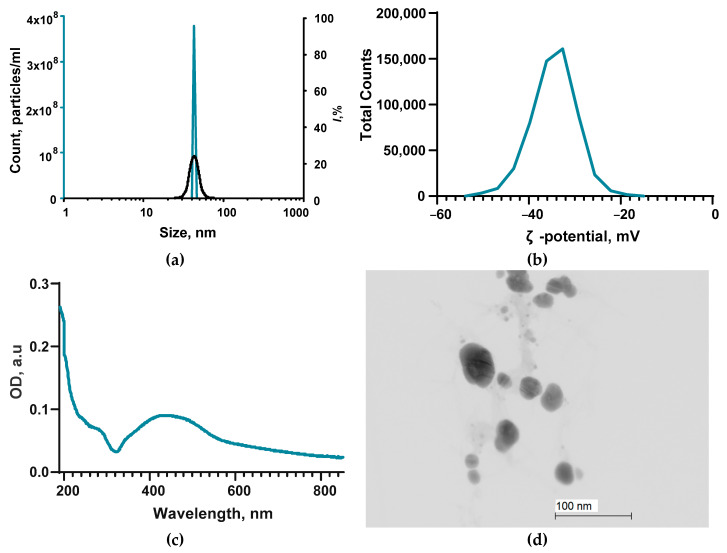
Figure 1.
Main characteristics of Ag2O NPs: (a) Size distribution of NPs obtained by DLS (blue line) and CPS (black line). (b) NP distribution over the ζ-potential obtained by the ELS method. (c) Absorption spectrum from the UV–vis region of the NP colloid. (d) TEM photograph of the obtained NPs. Scale bar: 100 nm.

