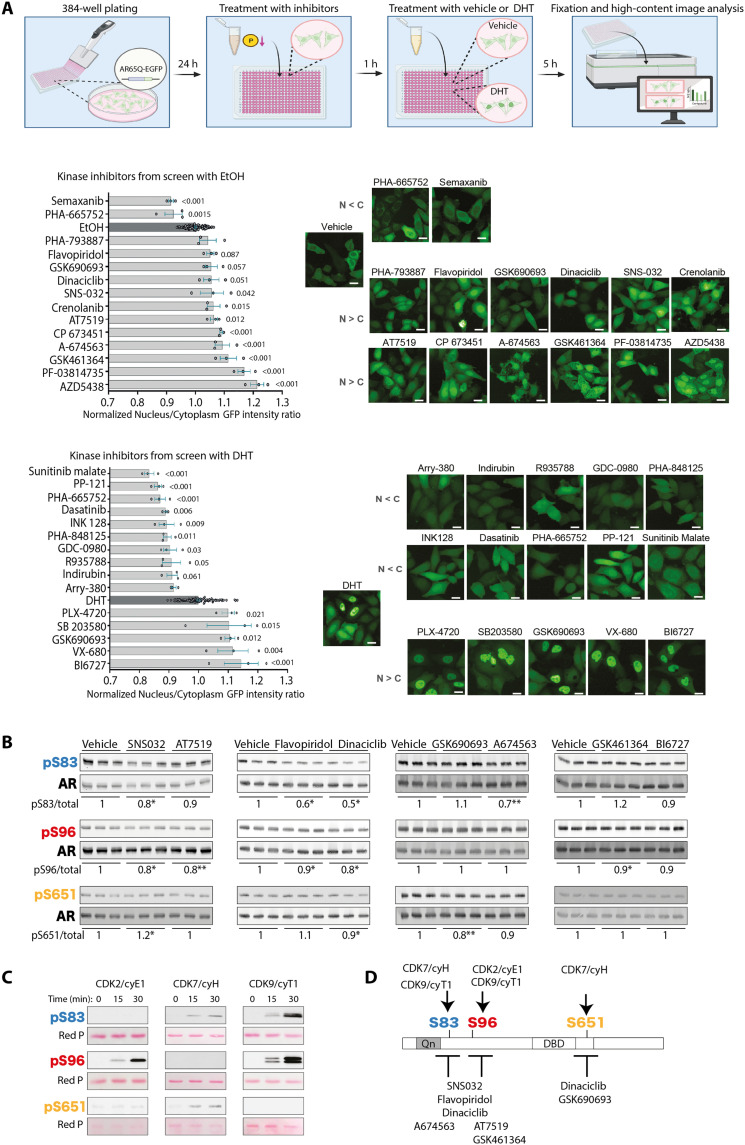
Fig. 3. Loss-of-function drug screening identifies AR as the target of multiple CDKs.
(A) Top: Scheme of experimental workflow. Left: High-throughput loss-of-function screening of small chemical inhibitors targeting kinases carried out in HeLa cells expressing polyQ-expanded AR tagged with EGFP (AR65Q-EGFP) and treated with vehicle [ethanol (EtOH)] or DHT (10 nM) and the indicated drugs (10 μM) (n = 96 wells EtOH/DHT-treated cells; n = 3 wells inhibitor-treated cells). Right: Representative fluorescence images. Scale bars, 25 μm. (B) Western blot analysis of AR phosphorylation after treatment with the indicated inhibitors (200 nM, 5 hours). Quantification of phosphorylated versus total AR is shown at the bottom of each panel (n = 3 biological replicates). (C) Western blot analysis of AR phosphorylation in time course in vitro phosphorylation assays with the AR NTD fragment (amino acids 1 to 153 for S83 and S96) and AR DBD-hinge region (amino acids 556 to 670 for S651) incubated with CDK2/cyE1, CDK7/cyH, or CDK9/cyT1 (n = 2 biological replicates). Total protein is shown by red ponceau (Red P) staining. (D) Schematic representation of AR phosphorylation sites and the respective kinases and small chemical inhibitors identified through drug screening and in vitro phosphorylation assays. Graphs show means ± SEM, one-way analysis of variance (ANOVA) followed by Dunnett’s multiple comparisons test, *P < 0.05 and **P < 0.01. Phosphorylated AR was detected using phospho-specific antibodies, and the total AR was detected with a specific antibody that recognizes AR independently of phosphorylation status.

