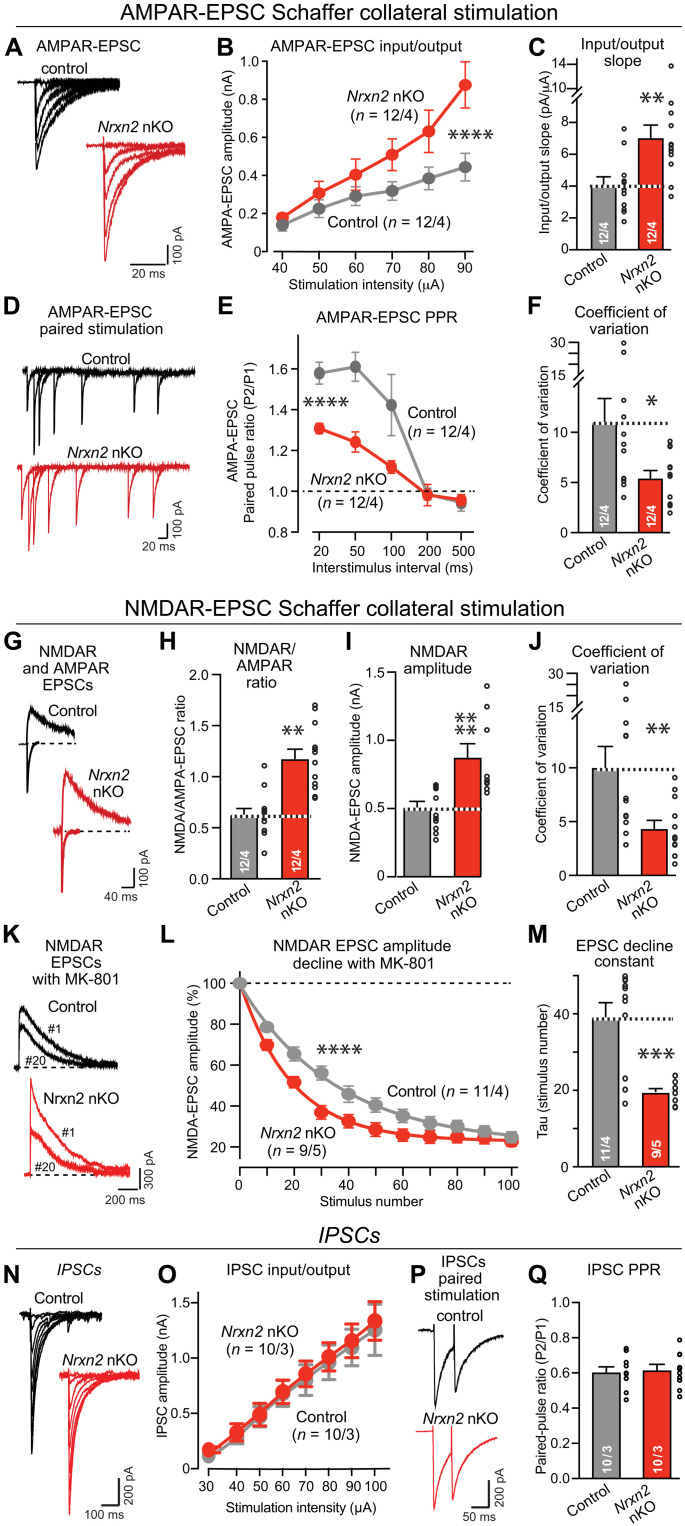
Fig. 3. The pan-neuronal deletion of Nrxn2 (Nrxn2 nKO) elevates CA3➔CA1 synaptic connectivity and increases the release probability at CA3➔CA1 synapses.
(A to C) Nrxn2 neuron-specific KO (nKO) increases AMPAR-mediated synaptic responses elicited by Schaffer collateral stimulation in acute slice from littermate control and Nrxn2 nKO mice [(A) representative traces of AMPAR-EPSCs evoked by electrical stimulation with increasing intensity; (B) input/output curve; (C) summary graph of the input/output slope]. (D to F) Nrxn2 nKO increases presynaptic release probability as demonstrated by a decreased paired-pulse ratio (PPR) and a lower coefficient of variation of AMPAR-EPSCs [(D) representative traces; (E) summary plot of PPRs; (F) summary graph of the coefficient of variation]. (G to J) Nrxn2 nKO enhances NMDAR/AMPAR ratio by increasing NMDAR-mediated synaptic responses more strongly than AMPAR-mediated responses [(G) representative traces of NMDAR-EPSCs and AMPAR-EPSCs monitored in the same cell at a +40- and −70-mV holding potential; (H to J) summary graphs of the NMDAR-EPSC/AMPAR-EPSC ratio (H), the absolute NMDAR-EPSC amplitude (I), and the coefficient of variation of NMDAR-EPSCs (J)]. (K to M) Nrxn2 nKO increases presynaptic release probability as measuring the rate of NMDAR-EPSC decline during 0.1-Hz stimulus trains in the presence of 20 μM MK-801 [(K) representative traces of the 1st and 20th NMDAR-EPSCs in the train; (L) normalized NMDAR-EPSC amplitudes in the presence of MK-801; (M) summary graph of the decay constant]. (N and O) The Nrxn2 nKO has no effect on inhibitory postsynaptic currents (IPSCs) [(N) representative traces of IPSCs evoked by electrical stimulation with increasing intensity; (O) input/output curve]. (P and Q) Nrxn2 nKO has no effect on PPR in inhibitory synapses monitored with a 50-ms interstimulus interval [(P) representative traces; (Q) summary graph of the PPR). Numerical data are means ± SEM; the numbers of analyzed cells per mice are listed in bar graphs. Statistical assessments were performed by two-way ANOVA (B, E, L, and O) or Mann-Whitney tests comparing the Nrxn2 nKO to controls, with *P < 0.05; **P < 0.01, ***P < 0.001, and ****P < 0.0001.

