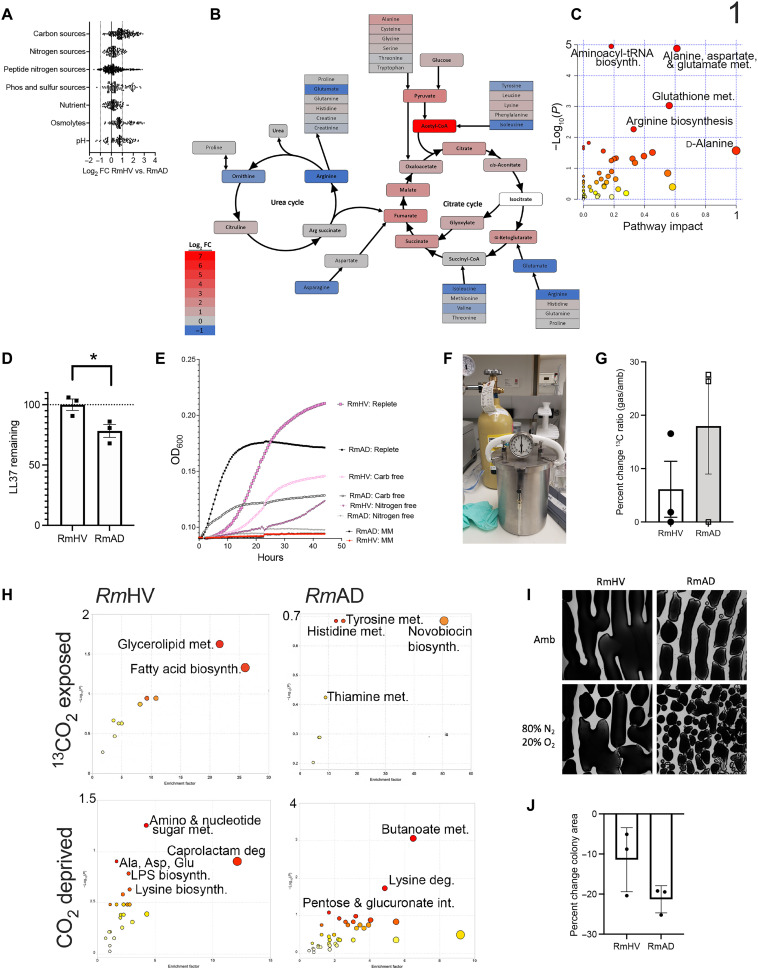
Fig. 1. R. mucosa from healthy controls shows differential carbon and nitrogen metabolism.
(A to J) Three different isolates of Roseomonas from healthy volunteers (RmHV1-3) and three different isolates of Roseomonas from patients with AD (RmAD1-3) were grown in the BioLog system, fold change (FC) for each challenge condition versus control was calculated, the log2FC for RmHV divided by the log2FC for RmAD is shown (A), and then the ratio of log2FC was superimposed onto the urea cycle (arginine biosynthesis) and citrate cycle (alanine, aspartate, and glutamate metabolism; H). (B and C) Individual BioLog components were ranked by significance and analyzed for pathways by MetaboAnalyst. (D) RmHV1-3 and RmAD1-3 were cultured with known amounts of LL-37 for 24 hours; supernatants were collected and assessed for remaining LL-37 by ELISA and the percentage of input LL-37 signal calculated and displayed. (E) Absorbance for cultures of RmHV1-3 or RmAD1-3 in medium with no energy source [minimal medium (MM)], with only carbohydrate energy sources (Nitrogen free), with only amino acid energy sources (Carb free), or with both (Replete). (F) Picture of experimental setup where anaerobic chambers were evacuated before filling with custom gas mixtures. (G) Total change in 13C to 12C ratio for all R. mucosa isolates after 48 hours in culture supplemented with 1% 13CO2. (H) MetaboAnalyst pathway analysis for RmHV1-3 and RmAD1-3 derived from metabolites with significant differences in 13C to 12C ratio after culture in 1% 13CO2 or metabolites differentially affected in RmHV by culture in ambient conditions or in CO2 deprivation (80% N2 and 20% O2). (I and J) Representative image (1.25×) of culture morphology (I) and statistical enumeration (J) of area covered per imaging field by culture of RmHV and RmAD in ambient or CO2 deprivation conditions. Data shown represent two or more independent experiments and are displayed as means ± SEM. For (C) and (H), only −log10 P values of >1 were considered significant.

