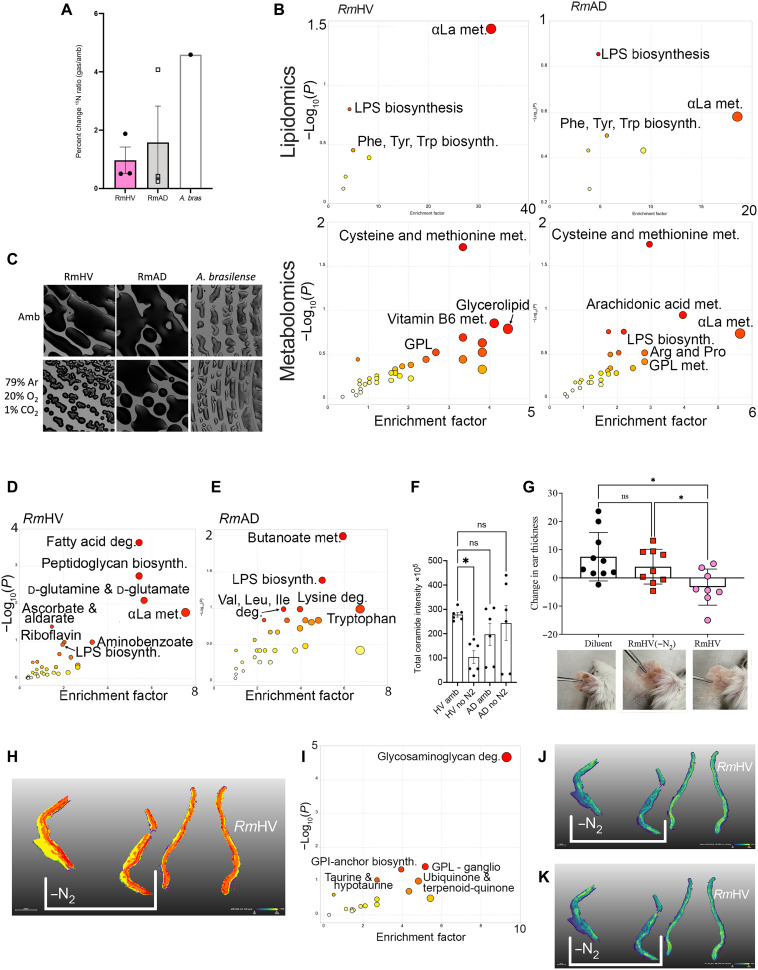
Fig. 2. Roseomonas isolates differ in nitrogen fixation.
(A) Total change in 15N to 14N ratio for three isolates of Roseomonas from healthy volunteers (RmHV1-3), three isolates of Roseomonas from patients with AD (RmAD1-3), or one isolate of A. brasilense (A. bras) cultured with 15N2 in head space. (B) Flux analysis was performed on metabolites with increase in 15N ratios; metabolites with greatest 15N change were ranked by P value and analyzed by MetaboAnalyst for pathways in lipidomic and metabolic acquisition conditions. (C) Representative images (1.25×) from spiral plated culture on agar for bacteria cultured in ambient air (Amb) or in head space devoid of N2 [79% argon (Ar), 20% oxygen (O2), and 1% carbon dioxide (CO2)]. (D and E) R. mucosa metabolites most affected by N2 deprivation were assessed by MALDI–time-of-flight (TOF) MS and analyzed for pathways affected by MetaboAnalyst. (F) Total intensity values for annotated ceramide containing compounds assessed by MALDI. (G) Mice treated in the MC903 model of AD for 8 days of dermatitis induction, 3 days of treatment with either RmHV cultured in ambient conditions of N2 deprivation (−N2), and then 4 days of observation; change in mouse ear thickness between days 8 and 15 is shown. Reduced thickness indicates reduced swelling and improved outcomes. (H) MALDI-MSI performed on mouse ears; segmentation performed by SCiLS Lab. (I) Pathway analysis derived from metabolites that best distinguish mice ears treated with RmHV1 from ambient conditions versus treatment with RmHV1 cultured in N2 deprivation. (J and K) Distribution of indicated metabolites as indicated by MALDI-MSI. GPL, glycerophospholipids; GPI, glycerophosphatidylinositol; deg., degradation; αLa, α-linolenic acid. Data shown represent two (G to K) or three or more (A to F) independent experiments. *P < 0.05; ns, not significant as determined by ANOVA.

