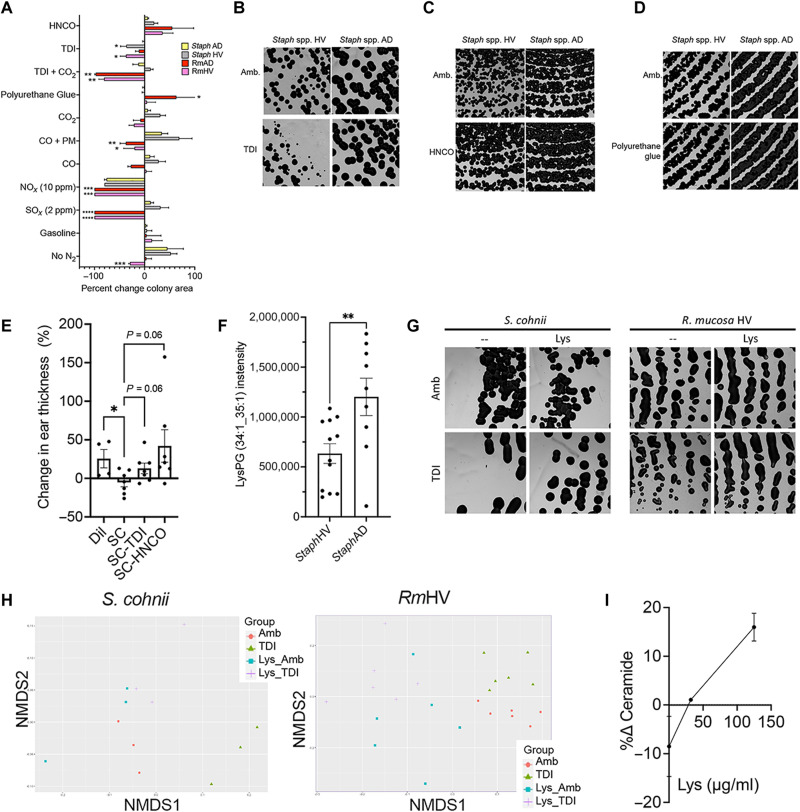
Fig. 8. TDI and HNCO disrupt beneficial pathways in S. cohnii.
(A) Percent change in growth area for RmHV1-3, RmAD1-3, Staph HV1-3, and Staph AD1-3 as quantified from images shown in Figs. 1I, 2C, 4D, 5 (A, E, F, and I), and 8 (B to D and G). Significance is indicated versus Staph AD group. Impacts of NOx on Staph taken from (62). (B to D) Representative image of Staph HV1-3 and Staph AD1-3 cultured with TDI (B), HNCO (C), or polyurethane-containing glue (D). (E) Change in mouse ear thickness in MC903 mouse model after treatment with S. cohnii grown under ambient conditions or with exposure to TDI or HNCO. (F) Intensity levels of LysPG identified by mass/charge ratio and collisional cross section for the three isolates of StaphHV and three isolates from StaphAD. (G and H) Representative images (G) and non-metric multi-dimensional scaling (NMDS) plots (H) for S. cohnii and RmHV1 exposed to TDI with and without pretreatment with lysine (Lys) supplementation. (I) Change in total annotated ceramides with exposure to TDI versus ambient for RmHV with and without Lys supplementation pretreatment. All images were taken at ×1.25 magnification. Data are representative of two or more independent experiments and are displayed as means ± SEM. *P < 0.05, **P < 0.01, and ***P < 0.001 as determined by ANOVA.

