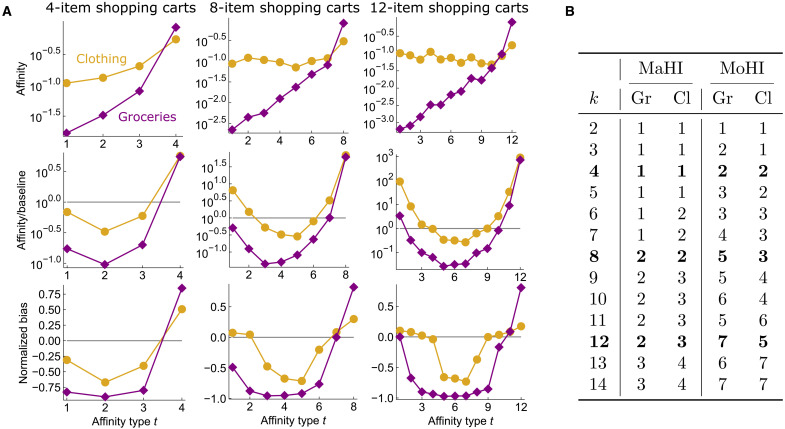
Fig. 5. Measures of homophily with respect to product type for groups of copurchased retail products.
(A) Affinity, ratio, and normalized bias scores for a hypergraph where nodes indicate clothes (Cl) and grocery (Gr) products at Walmart and hyperedges indicate sets of copurchased items during a shopping trip. The bowl-shaped ratio and normalized bias curves for both products indicate that it is typical for shopping trips to primarily focus on one type of product or the other. The fact that affinity scores for grocery products are mostly increasing, while affinity scores for clothing are mostly flat, also matches basic intuition about shopping trips. For example, the relatively small gap between type-k and type–(k – 1) affinities for clothing is indicative of the fact that when going clothes shopping, it is not uncommon to pick up a needed grocery item while at the store. In contrast, when grocery shopping, it is much less common to additionally pick up a small number of clothing items at the store. This is reflected in the larger gaps between affinity scores and normalized bias scores for groceries. (B) The MaHIs grow as shopping basket size increases. MoHIs are also high for both classes.

