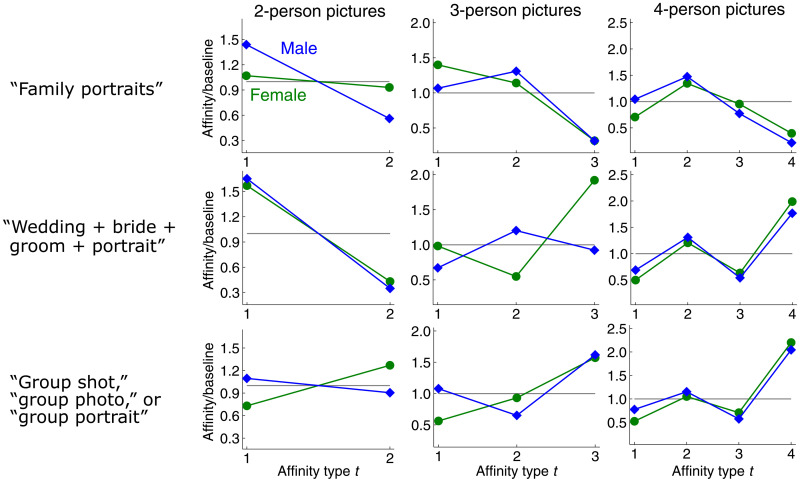
Fig. 6. Ratio scores with respect to gender for three collections of group pictures, obtained via three image search queries on Flickr.
Normalized bias scores capture the same trends. Hypergraph measures provide richer information than graph homophily indices obtained by collapsing pictures into pairwise relationships based on coappearance. For family pictures (top row), ratio scores capture the intuition that all-male and all-female family pictures are statistically uncommon, as shown by low ratio scores for three- and four-person pictures of all men or all women. Meanwhile, the graph homophily indices for men and women when collapsing all family pictures into pairwise relationships are 0.43 and 0.41, respectively, just below the baseline of 0.5 for balanced classes. Ratio scores for four-person wedding pictures (middle row) or general group pictures (bottom row) indicate a high frequency of social gatherings of all men or all women. The slightly higher-than-random affinities for gatherings with two men and two women are possibly due to a high number of pictures of two opposite-gender couples. Two-person wedding photos are likely to be of a bride and groom, which is reflected in low type-2 ratio scores (first column, middle row). However, pictures with three or four people are often gender homogeneous. This information is lost when collapsing all pictures into pairwise coappearances, in which case the resulting graph homophily indices of 0.57 and 0.55 are both slightly above baseline (0.5). Results for the dataset are robust to perturbations; we see similar patterns from average affinity scores obtained from different subsamples of each dataset (see the Supplementary Materials).

