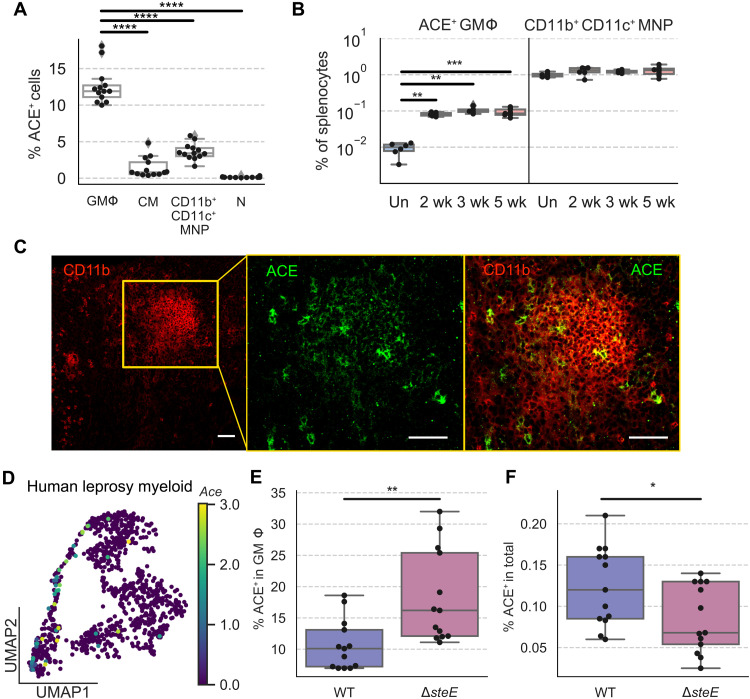
Fig. 4. Splenic ACE+ macrophage population expands during infection and contributes to granuloma formation.
(A) Mice were infected with WT STm and analyzed at 1 month after inoculation. Percent frequencies of ACE+ cells among GMΦs, CMs, CD11b+CD11c+ MNPs, and neutrophils (N) by flow cytometry. (B) Percent frequencies of ACE+ granuloma MΦs (left) and CD11b+CD11c+ MNPs (right) in total splenocytes at indicated time points after inoculation. Un, uninfected. (C) Immunofluorescence staining STm granuloma MΦs for CD11b (red) and ACE (green). Orange square on the left panel indicates the zoomed region shown in the two right panels. Scale bars, 50 μm. (D) UMAP projection of myeloid cells in human leprosy granulomas with scaled ACE expression overlaid on top. In these human myeloid cells, ACE expression is detected primarily in cluster 3 MΦ and cluster 2 Trem2+ MΦ (45). (E and F) Mice were infected with either WT STm or ΔsteE STm and analyzed at 1 month after inoculation by flow cytometry. (E) Percent frequencies of ACE+ cells among granuloma MΦs. (F) Percent frequencies of ACE+ granuloma MΦs among total splenocytes. (A, B, E, and F). Dots: Individual mice. Significance calculated using a two-tailed Mann-Whitney test. *P < 0.05, **P < 0.01, ***P < 0.001, and ****P < 0.0001. (A) n = 13 mice, three independent experiments. (B) n ≥ 6 mice per group, two independent experiments. (C) n = 5 mice, multiple sections per mouse, three independent experiments. (E and F) n = 13 mice per group, three independent experiments.

