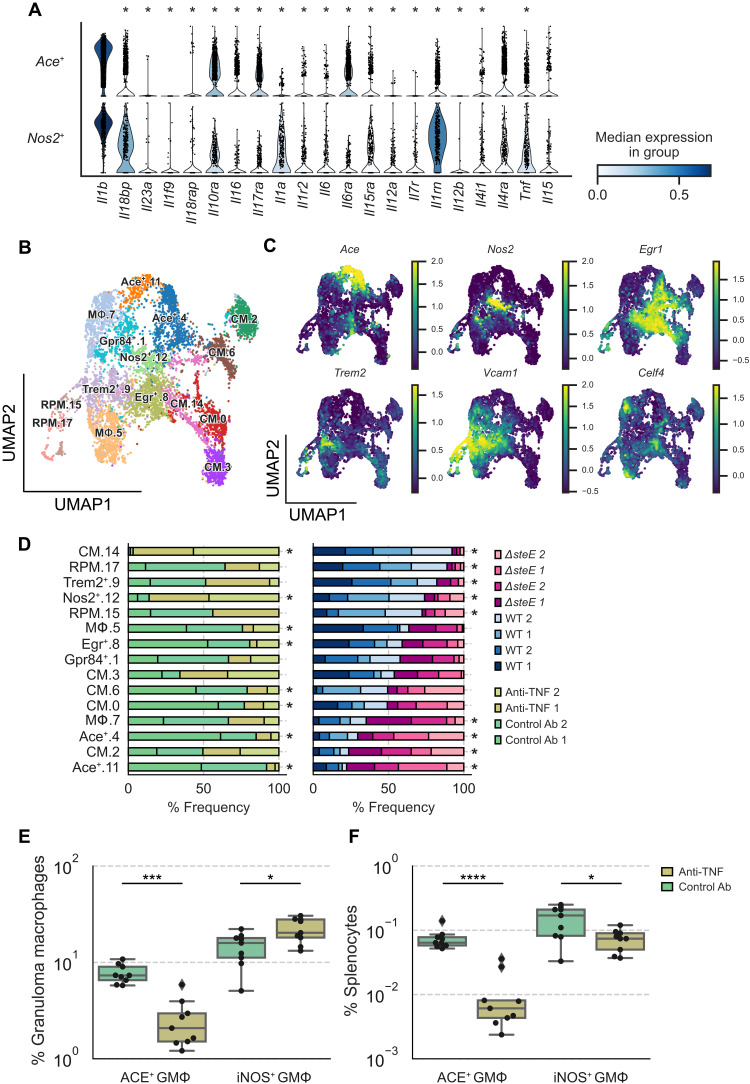
Fig. 6. Disruption of pathogen control by TNF neutralization preferentially depletes ACE+ macrophages.
(A) Violin plot highlighting cytokines that are differentially expressed between Ace+ and Nos2+ MΦs in WT STm- or ΔsteE STm-infected mice (see Fig. 3A) (FDR < 0.05). (B) Combined UMAP projection of scRNA-seq monocyte and MΦ subsets from mice that were treated with isotype control or anti-TNF antibody. Cells are colored by cell state assignment. (C) Expression levels of enriched marker genes of MΦ clusters: Ace, Nos2, Egr1, Trem2, Vcam1, and Celf4. (D) Differential representation test for monocyte and MΦ clusters in WT STm-infected mice that have been treated with isotype control or anti-TNF antibody (left) or mice infected with WT STm or ΔsteE STm (right). Asterisk next to the bar indicates a greater than twofold difference in representation ratio and statistical significance between treatments based on a differential representation test (FDR < 0.05; see Materials and Methods). Mice were chronically infected with WT STm for 1 month, treated with isotype control or anti-TNF antibodies on day 1, and analyzed by flow cytometry or prepared for scRNA-seq on day 4. (E) Percent frequencies of ACE+ and iNOS+ cells among splenic granuloma MΦs from animals treated with isotype control and anti-TNF antibody. (F) Percent frequencies of ACE+ and iNOS+ granuloma MΦs in total splenocytes from isotype control and anti-TNF–treated animals. (E and F) Dots: Individual mice. Significance calculated using a two-tailed Mann-Whitney test. *P < 0.05, ***P < 0.001, and ****P < 0.0001. (E and F) n = 9 mice per group, two independent experiments. Ab, antibody.

