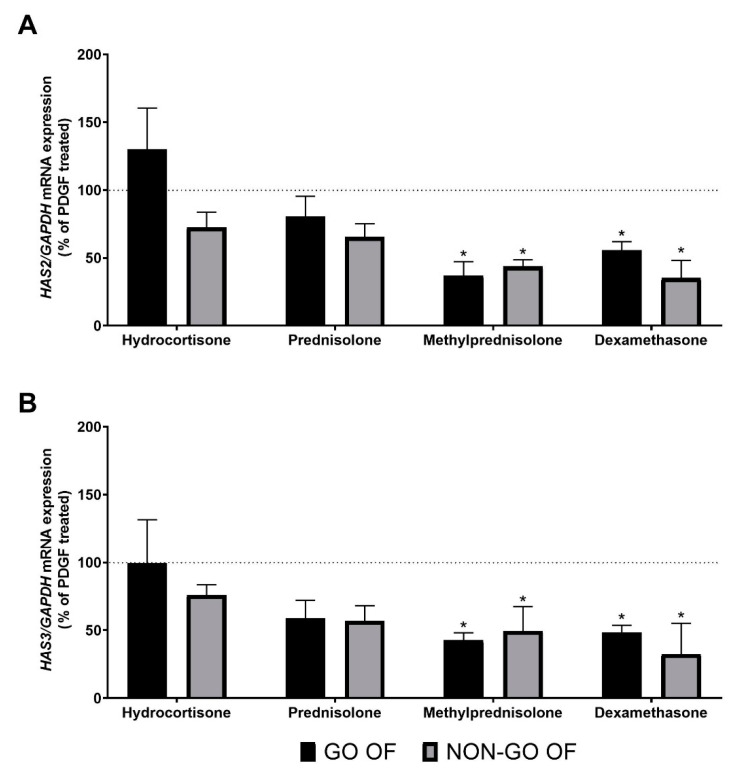
Figure 4.
The effect of GCs (1 µM) on (A) HAS2 and (B) HAS3 mRNA expression after PDGF-BB treatment. The dotted line represents the mRNA expression of PDGF-BB stimulated cultures. Data were analyzed using a repeated measure ANOVA followed by Dunnett’s test. Result shown are the mean ± SEM. * p < 0.05. GO OF—Graves’ orbitopathy fibroblasts, NON-GO OF—control orbital fibroblasts, DF—dermal fibroblasts, HAS2—hyaluronan synthase 2, HAS3—hyaluronan synthase 3, GAPDH—glyceraldehyde 3-phosphate dehydrogenase.

