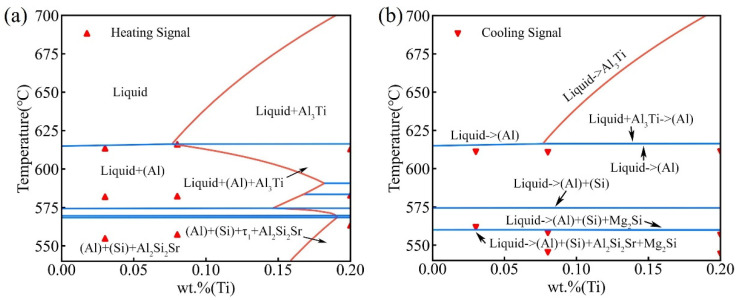
Figure 4.
(a) Calculated equilibrium vertical section of A356-0.005Sr-xTi (in wt.%), compared with the experimental data from the DSC heating curves; (b) constructed solidification diagram of A356-0.005Sr-xTi (in wt.%) using the Scheil-Gulliver mode, compared with the experimental data from the DSC cooling curves.

