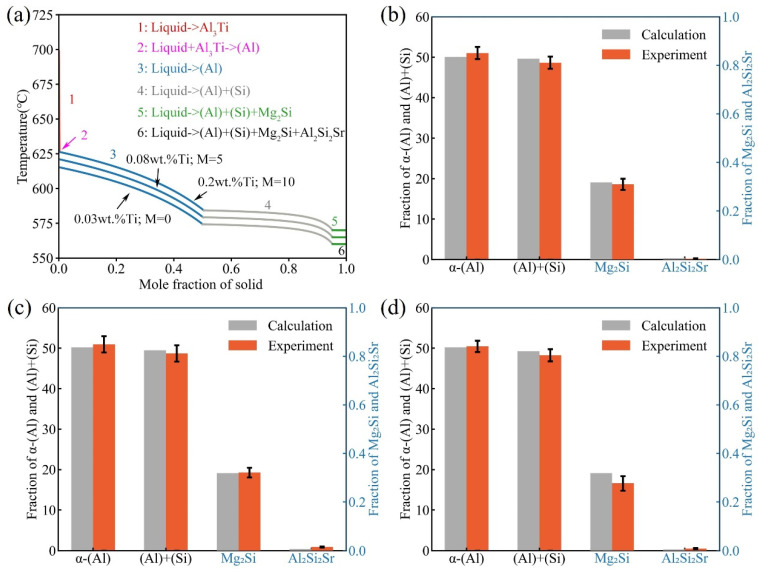
Figure 5.
(a) Simulated solidification curves of different alloys (Al-7.0Si-0.4Mg-0.005Sr-0.03Ti, Al-7.0Si-0.4Mg-0.005Sr-0.08Ti, and Al-7.0Si-0.4Mg-0.005Sr-0.20Ti) under the Scheil-Gulliver conditions; comparison of the model-predicted volume fractions of α-(Al), (Al)+(Si), Mg2Si, and Al2Si2Sr phase and the measured values in (b) Al-7.0Si-0.4Mg-0.005Sr-0.03Ti, (c) Al-7.0Si-0.4Mg-0.005Sr-0.08Ti, and (d) Al-7.0Si-0.4Mg-0.005Sr-0.20Ti alloys.

