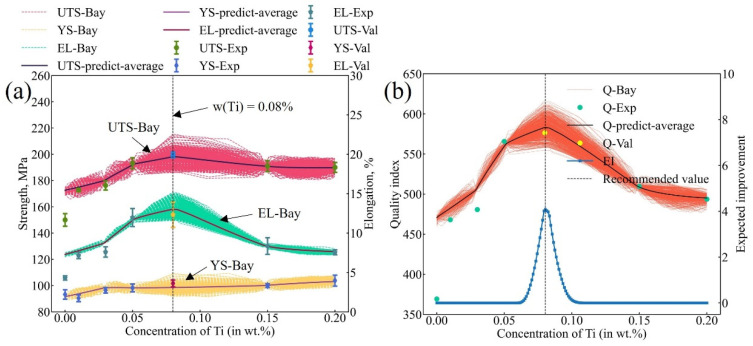
Figure 10.
Experimental verification results of predicted optimal Ti content in A356-0.005Sr alloy. (a) Experimental results of mechanical properties with predicted optimal Ti content in A356-0.005Sr alloy (i.e., 0.08%, the corresponding results are represented as UTS-Val, YS-Val, and EL-Val). (b) Experimental validation results expressed as a quality index, where the quality index for optimal Ti content is represented as Q-Val.

