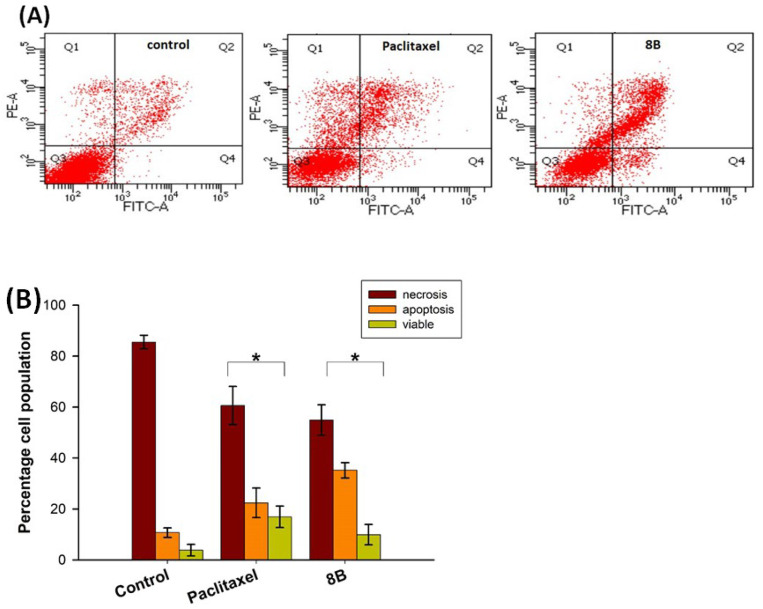
Figure 4.
Flow cytometric analysis of cell death in MSTO-211H cells treated for 24 h with 12 nM paclitaxel and 1.5 μM 8B, and stained with FITC-conjugated Annexin V and PI. (A) Dot plots of a representative experiment for untreated cells (control) and cells treated with paclitaxel, or 8B. (B) Percentages of viable (Q3), apoptotic (Q2 + Q4), and necrotic (Q1) cells. Values are the mean ± SD of three independent experiments in duplicate. * p < 0.05, significant difference in comparison to the control sample.

