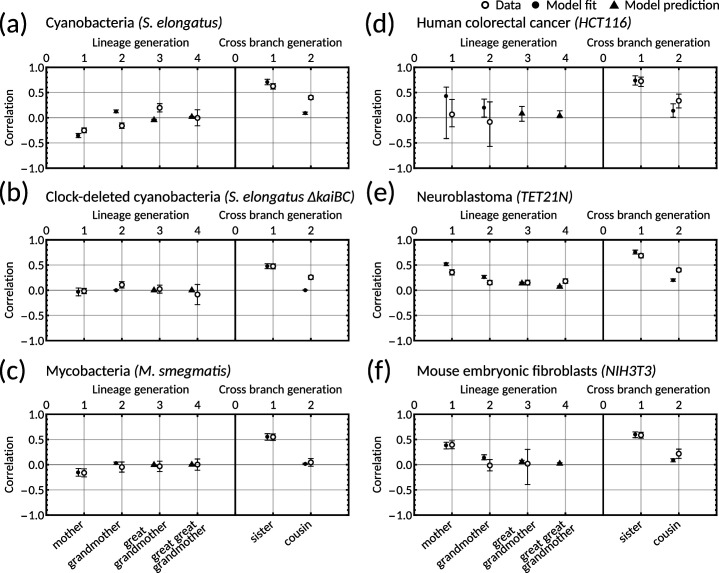
Appendix 1—figure 1. One-dimensional model with simple inheritance rules results in a poor fit for datasets displaying the cousin-mother inequality.
(a–f) Plots showing data (open markers) against model predictions (solid black) for the one-dimensional model Cowan and Staudte, 1986 for (a) cyanobacteria, (b) clock-deleted cyanobacteria, (c) mycobacteria, (d) human colorectal cancer, (e) neuroblastoma and (f) mouse embryonic fibroblasts. We fit the model using the same likelihood function (Equation M10) and methods (Materials and methods - ‘Data analysis and Bayesian inference of the inheritance matrix model‘) as in the main text. Points (black) give the median model output for each correlation and error bars give the 95% bootstrapped confidence intervals from 10,000 re-samplings with replacement. Circular points show the model fitted correlations (mother-daughter, grandmother-granddaughter, sister-sister and cousin-cousin) whereas triangular points demonstrate model predictions. For this fitting we used 100,000 samples (in contrast to 10 million used in the main text).

