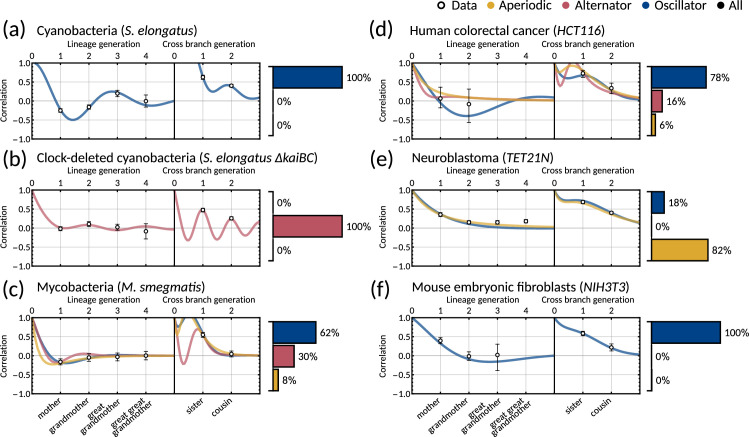
Appendix 1—figure 4. Two-dimensional inheritance matrix model gives a good fit for
Same panels as in Figure 3 but with and showing only one sample. We show the calculated family correlations with 95% bootstrapped confidence intervals (open markers) and a single sample of the model fit for (a) cyanobacteria, (b) clock-deleted cyanobacteria, (c) mycobacteria, (d) human colorectal cancer, (e) neuroblastoma and (f). Posterior parameter sets are clustered by correlation patterns (bar charts.) For this fitting we used 100,000 samples (in contrast to 10 million used in the main text). We see a similar fit and pattern distributions for all cell types except for mycobacteria (c), which here displays a dominant oscillator pattern.

