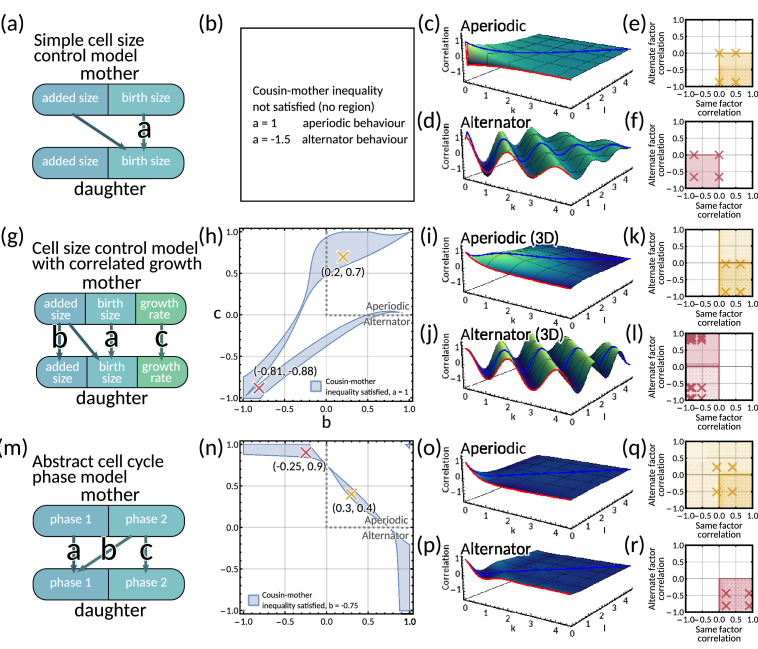
Appendix 1—figure 5. Mapping mechanistic models to the inheritance matrix model framework.
(a–f) Simple cell size control model. (a) Model schematic. (b) The cousin-mother inequality cannot be satisfied for any choice of parameter . (c–d) Generalised tree correlation function plots (c) for and (d) resulting in aperiodic and an alternator pattern respectively. (e–f) Same vs alternate factor mother-daughter correlation plots for (e) and (f). In panels (b–f) we fix . (g–l) Cell size control model with correlated growth rate. (g) Model schematic. (h) Region plot with fixed parameter showing the parameter space that satisfies the cousin-mother inequality (blue). Example parameter choices are also plotted for an aperiodic (yellow) and an alternator (red) pattern. (i–j) Generalised tree correlation function plots for (i) and (j) resulting in aperiodic and an alternator pattern respectively. (k,l) Same vs alternate factor mother-daughter correlation plots for (k) and (l). In panels (h–l) we fix . (m–r) Two cell cycle phase model (m) Model schematic. (n) Region plot with fixed parameter showing the parameter space that satisfies the cousin-mother inequality (blue). Example parameter choices are also plotted for an aperiodic (yellow) and an alternator (red) pattern. (o–p) Generalised tree correlation function plots (o) for and (p) resulting in aperiodic and an alternator pattern respectively. (q–r) Same vs alternate factor mother-daughter correlation plots for (q) and (r). In panels (n–r) we fix .

