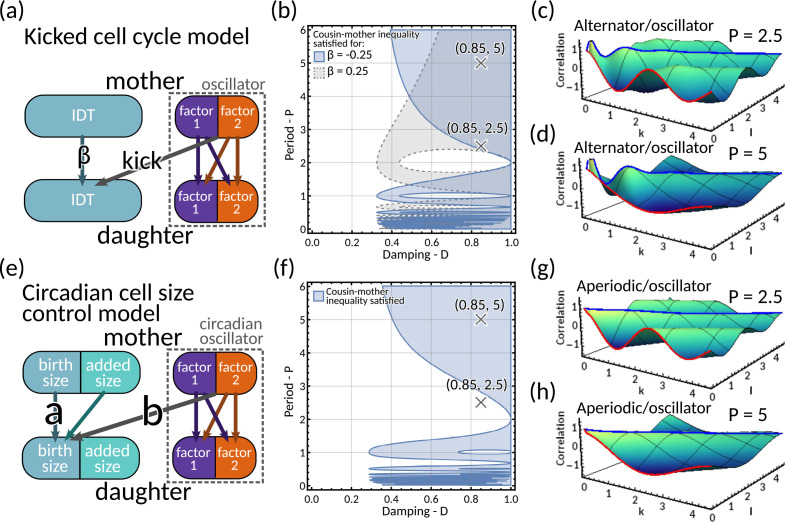
Appendix 1—figure 6. Models of circadian-clock-driven correlation patterns (a–d) Kicked cell cycle model.
(a) Model schematic. The mother to daughter IDT inheritance is given by where is the size control parameter. The ‘kick’ to the cell cycle us produced by a two-dimensional complex eigenvalued inheritance matrix model system with oscillator behaviour. (b) Region plot for (blue) and (grey), demonstrating the region for this model where the cousin inequality is satisfied. Here we fix the variances of the noise terms and all equal to 0.1. (c–d) Plot of the generalised tree correlation function for (c) and (d) . In both these plots we take , meaning the model has a mixture of alternator and oscillator behaviours. The cousin inequality is satisfied for both these parameter choices. (e–h) Circadian cell size control model (e) Model schematic. The parameter gives how the daughter’s birth size depends on the mother’s birth size; and gives the coupling of the circadian oscillator to the size control. (f) Region plot demonstrating where the cousin inequality is satisfied. We fix . Correlations between noise terms are fixed equal to 0 and we set for . (g–h) Plots of the generalised tree correlation function for the same fixed parameters specified in panel (f), with (g) , and (h) . As we fix , these plots show a combination of aperiodic and oscillator behaviour. We note that for , the cousin inequality is not satisfied. This demonstrate that oscillatory behaviour is not a necessary condition for the cousin inequality to be satisfied.

