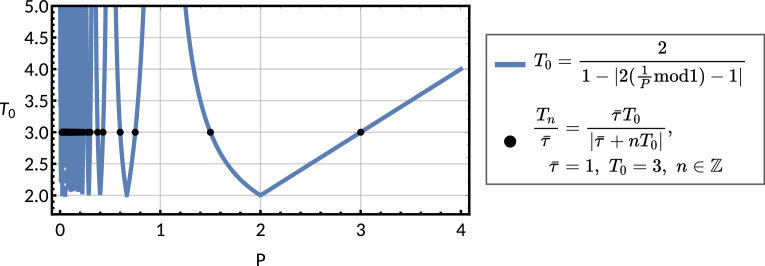
Appendix 1—figure 8. Observed period against chosen period parameter for a forced oscillator pattern.
Plot of the function for against the observed lineage correlation function period given in Equation M9 (blue line), for an oscillator pattern given in ‘The inheritance matrix model reveals three distinct interdivision time correlation patterns’. We see that for . For chosen with and various we see how the parameters that produce the corresponding s are directly equal to the possible we can derive from the chosen (black points), using Equation 7.

