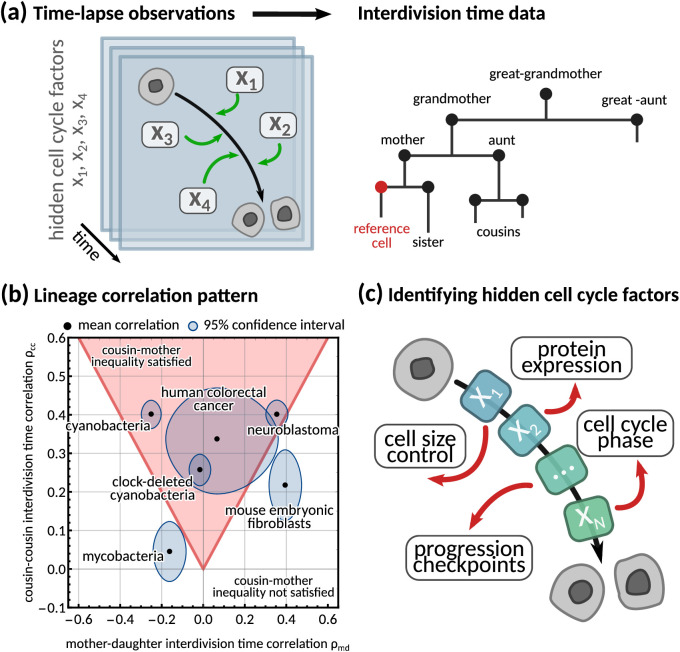
Figure 1. Using interdivision time data on lineage trees to infer the hidden cell cycle factors.
(a) Time lapse observations. Cartoon demonstrating how time-lapse microscopy allows single cells to be tracked temporally as they go through the cell cycle to division. Multiple different factors affect the rate at which cells progress through the cell cycle from birth to subsequent division. Interdivision time data. Example lineage tree structure with possible ‘family relations’ of a cell between which correlations in interdivision time can be calculated. (b) Lineage correlation pattern. Plot of mother-daughter interdivision time correlation against cousin-cousin interdivision time correlation for the six publicly available datasets used in this work (Appendix 1—table 1, Martins et al., 2018; Priestman et al., 2017; Chakrabarti et al., 2018; Kuchen et al., 2020; Mura et al., 2019). The shaded red area indicates the region where the cousin-mother inequality is satisfied. (c) Identifying hidden cell cycle factors. Schematic showing the model motivation and process. We produce a generative model that describes the inheritance of multiple hidden ‘cell cycle factors’ that affect the interdivision time. The model is fitted to lineage tree data of interdivision time, and we analyse the model output to reveal the possible biological factors that affect the interdivision time correlation patterns of cells.

