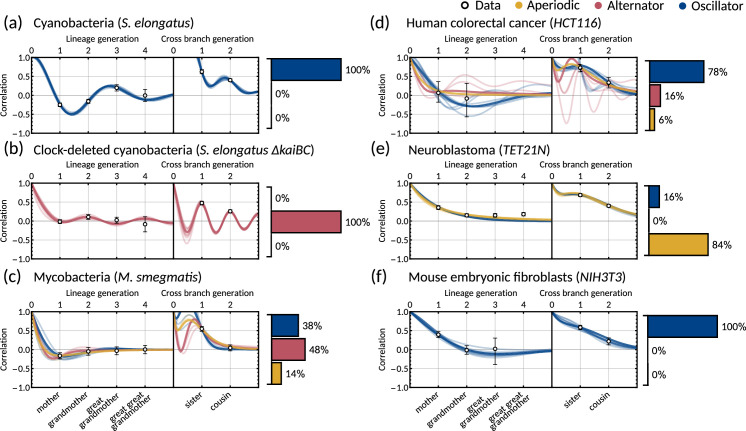
Figure 3. The inheritance matrix model with two cell cycle factors fits interdivision time correlation patterns for a range of cell types.
Posterior correlation functions based on fitting to mother-daughter, grandmother-granddaughter, sister-sister and cousin-cousin correlations for three bacterial (left) and three mammalian (right) datasets: (a) cyanobacteria, (b) clock-deleted cyanobacteria, (c) mycobacteria, (d) human colorectal cancer, (e) neuroblastoma, and (f) mouse embryonic fibroblasts. Pearson correlation coefficients (white circles) and 95% bootstrapped confidence intervals (error bars) obtained through re-sampling with replacement of the original data (10,000 re-samples). Posterior distribution samples were clustered into aperiodic, alternator, and oscillator patterns (bar charts). We show multiple representative samples (solid and shaded lines) drawn from the posterior distribution Appendix 1—figure 2 without clustering. Where correlations appear missing, this is in cases where the lineage trees in the data were not deep enough for the correlations to be calculated. Only lineage and cross branch generations 1 and 2 were used in model fitting. Here all panels assume , but taking produces similar results (Appendix 1—figure 4).

