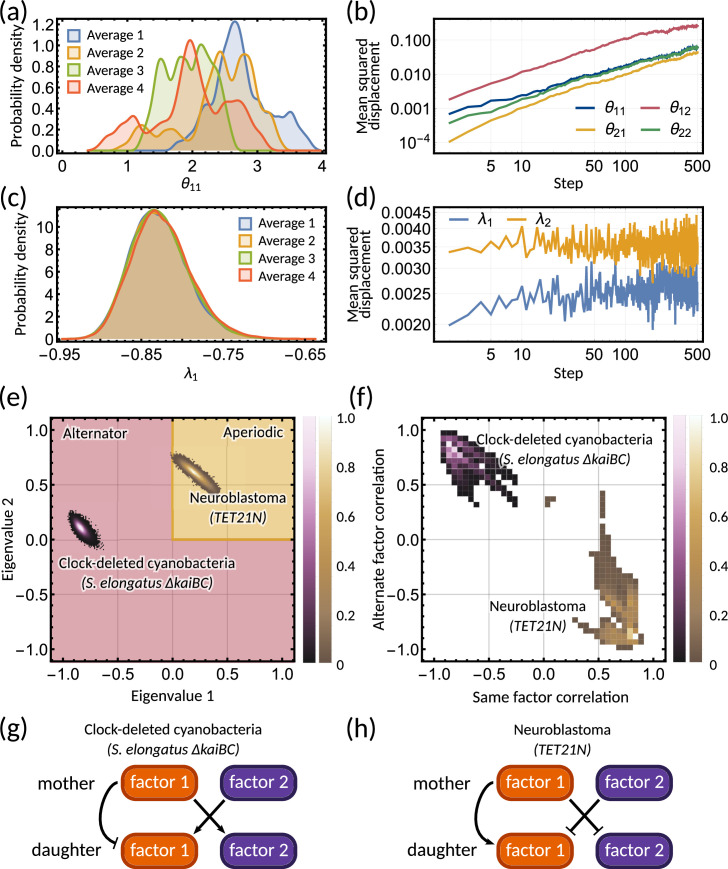
Figure 4. Bayesian inference predicts hidden dynamical correlations between cell cycle factors.
(a) Posterior distribution histograms for depend on the realisations of a Gibbs sampler and do not settle to a stationary distribution. (b) A log-log plot of mean squared displacement for the four variables that make up the inheritance matrix . The mean squared displacement for all four parameters increases linearly, meaning the sampling does not settle in any particular region of parameter space. (c) Sampled posterior distribution histograms for the eigenvalue for each realisation. The histograms are almost identical across the four averages, showing the distribution has converged. (d) Mean squared displacement for the eigenvalues of the inheritance matrix settles to a finite value. Plots (a) - (d) utilise sampling from the inference for the clock-deleted cyanobacteria dataset. (e) Density histogram of the real eigenvalue pairs for clock-deleted cyanobacteria (pink) and neuroblastoma (brown) demonstrating where the eigenvalues lie in the aperiodic (yellow) and alternator (red) regions. (f) Density histogram of same-factor against alternate-factor mother-daughter correlation for clock-deleted cyanobacteria (pink) and neuroblastoma (brown). We take a minimum threshold of 0.3 for the probability density to remove irrelevant samples. (g–h) Influence diagrams for same factor vs alternate factor correlations for (g) clock-deleted cyanobacteria and (h) neuroblastoma.

