. 2022 Dec 14;11:e80949. doi: 10.7554/eLife.80949

Figure 13. Schematic of TGAC8 heart performance and protection circuits that appeared to be concurrently engaged in the TGAC8 LV.

The pathways/specific targets and the effector functions/outcomes culminating from the regulation of the components within the circuits in the pathways are represented according to published literature with respect to cardiac-specific context (see Discussion). Pink colors represent proteins that differed by genotype in WB. Molecular targets or components in red, green, and grey represent molecular targets or components that are increased or upregulated, decreased or downregulated, or unchanged, respectively, in TGAC8 vs WT.

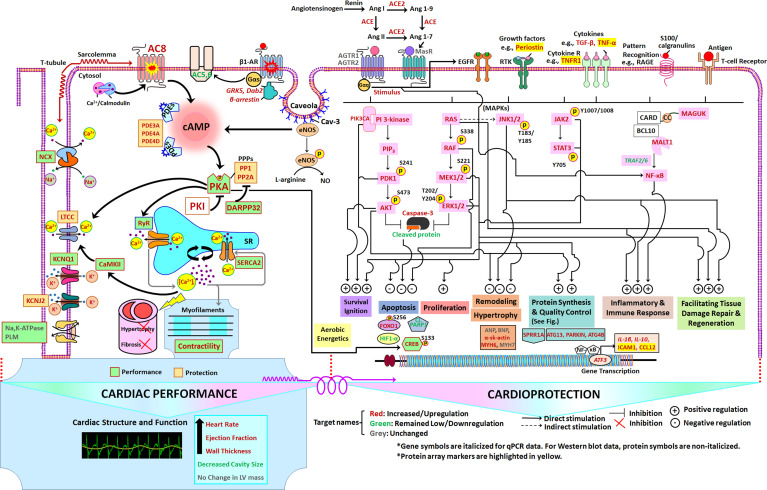
Figure 13.

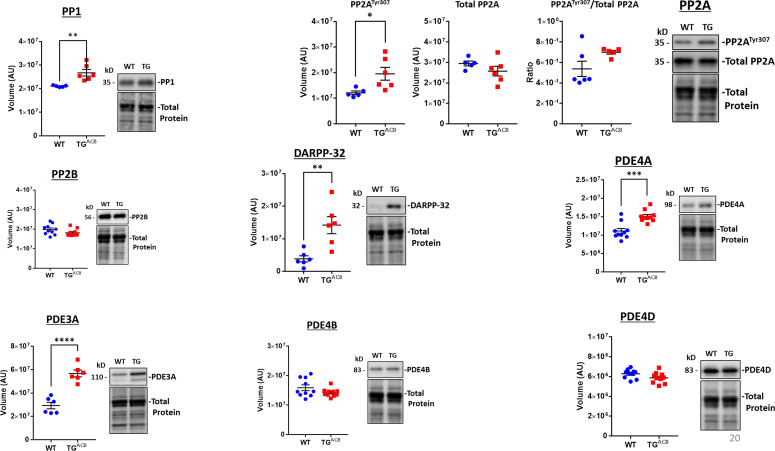
Figure 13—figure supplement 1. WB analyses of selected proteins within the performance and protection circuitry depicted in Figure 13.

Figure 13—figure supplement 1.

Negative feedback adaptations on AC/PKA signaling.Data are presented as Mean± SEM. The statistical significance is indicated by * p<0.05, ** p<0.01, *** p<0.001, **** p<0.0001 (two-tailed t test).
Figure 13—figure supplement 1—source data 1. Raw unedited blot images and uncropped blot images of PDE4B, PDE4D, PP1, PP2A, PP2B.
Figure 13—figure supplement 1—source data 2. Raw unedited blot images and uncropped blot images of PP2B, DARPP-32, PDE3A, PDE4A.
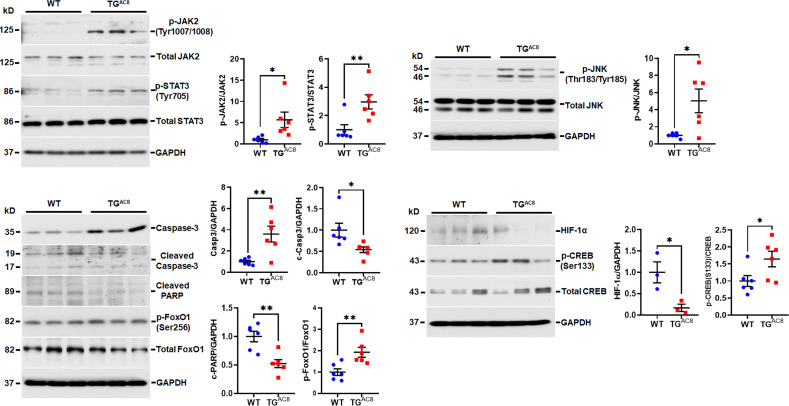
Figure 13—figure supplement 2. WB analysis of selected proteins involved in Jak/Stat/Jnk/Caspase signaling.

Figure 13—figure supplement 2.

Data are presented as Mean± SEM. The statistical significance is indicated by * p<0.05, ** p<0.01 (two-tailed t test).
Figure 13—figure supplement 2—source data 1. Raw unedited blot images and uncropped blot images of Caspase3, Cleaved Caspase3, Cleaved PARP, pFoxO1 (Ser256), GAPDH, HIF1α, JAK2 (Tyr1007/Tyr1008), pCREB (Ser133), pJNK (Thr183/Tyr185), pSTAT3 (Tyr705), total CREB, total FoxO1, total JAK2, total JNK, and total STAT3.
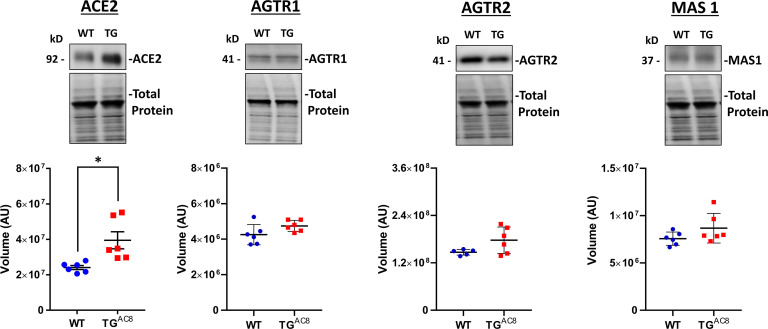
Figure 13—figure supplement 3. WB analysis of selected proteins involved in angiotensin receptor signaling Data are presented as Mean± SEM.

Figure 13—figure supplement 3.

The statistical significance is indicated by * p<0.05, ** p<0.01, *** p<0.001, **** p<0.0001 (two-tailed t test).
Figure 13—figure supplement 3—source data 1. Raw unedited blot images and uncropped blot images of ACE2, AGTR1, AGTR2, and MAS1.
Figure 13—figure supplement 4. WB analysis of Calnexin and Calreticulin, proteins involved in ER protein processing Data are presented as Mean± SEM.

Figure 13—figure supplement 4.

The statistical significance is indicated by * p<0.05, ** p<0.01 (two-tailed t test).
Figure 13—figure supplement 4—source data 1. Raw unedited blot images and uncropped blot images of CALR and CNX.
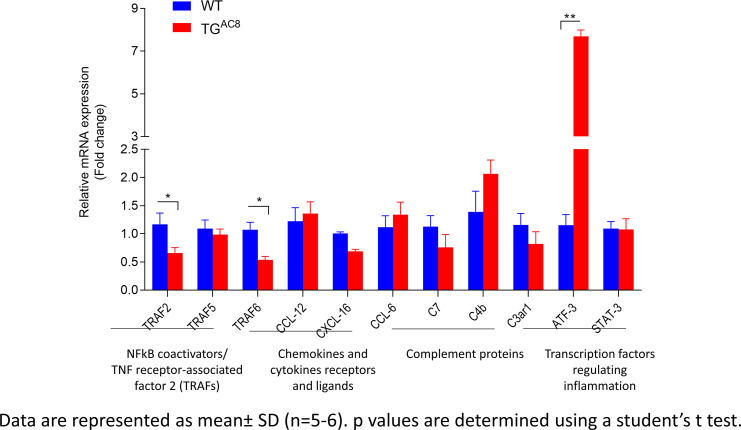
Figure 13—figure supplement 5. RT-qPCR analysis of genes regulating cytokines level in the LV.

Figure 13—figure supplement 5.

The statistical significance is indicated by * p<0.05, ** p<0.01.
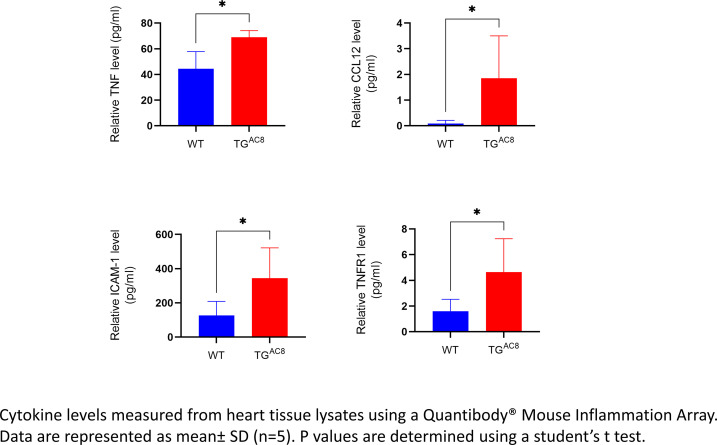
Figure 13—figure supplement 6. Cytokine levels measured from heart tissue lysates.

Figure 13—figure supplement 6.

The statistical significance is indicated by * p<0.05.
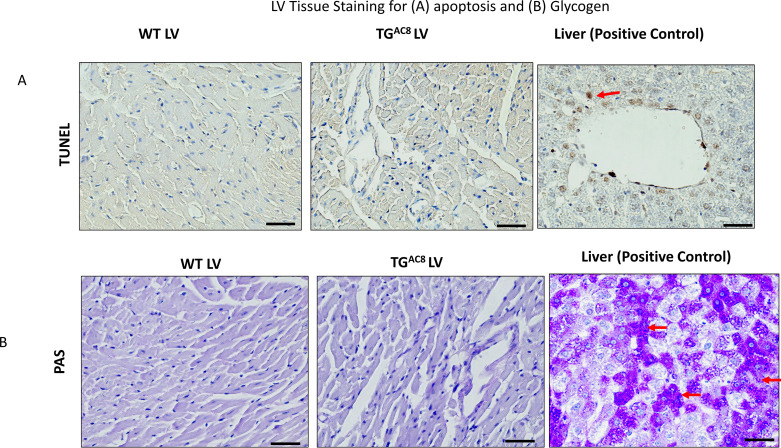
Figure 13—figure supplement 7. LV tissue staining for apoptosis and glycogen.

Figure 13—figure supplement 7.

Scale bar 100 µm.
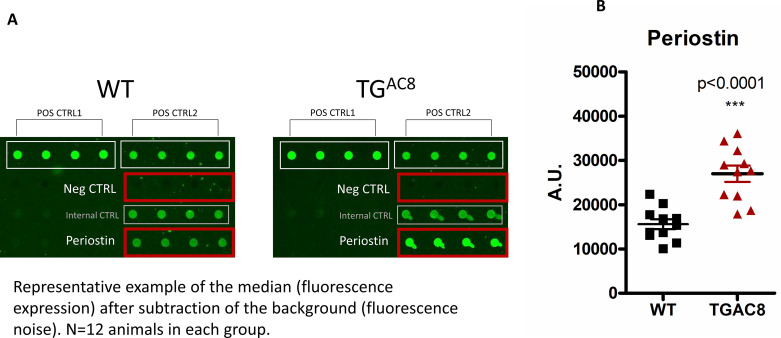
Figure 13—figure supplement 8. Periostin levels detected in TGAC8 vs WT LV (growth factor quantibody array).

Figure 13—figure supplement 8.

Data are presented as Mean± SEM (two-tailed t test).
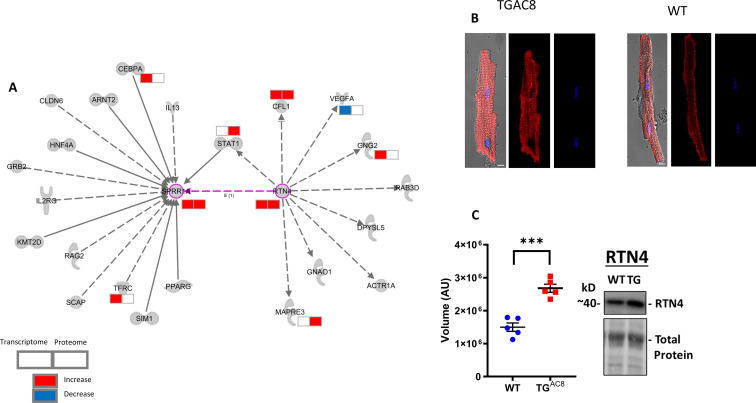
Figure 13—figure supplement 9. SPRR1A signaling network and Immunolabeling of SPRR1A.

Figure 13—figure supplement 9.

(A) SPRR1A signaling network, (B) Immunolabeling of SPRR1A in isolated LV myocytes, and (C) WB analysis of RTN4 expression. Data are presented as Mean± SEM. The statistical significance is indicated by **** p<0.0001 (two-tailed t test).