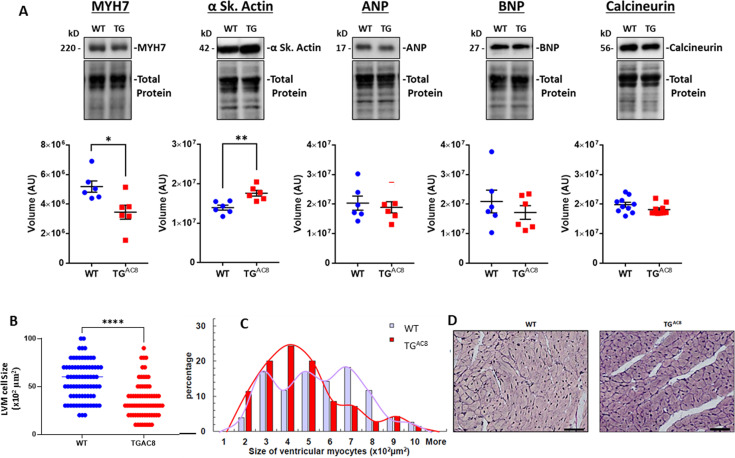
Figure 2. Expression of pathologic hypertrophy markers and cardiac myocyte sizes in LV of TGAC8 and WT mice.
(A) WB of Pathologic hypertrophy markers, (B, C) cardiac myocyte cross-sectional areas and distributions of cardiac myocyte sizes in TGAC8 and WT hearts (cardiomyocytes were counted on left free wall at the middle level sections from four animals in each group; 37 high power fields from WT mice and 33 high power fields from TGAC8 mice; 77 cells from WT mice and 70 cells from TGAC8 mice were analyzed) Data are presented as Mean± SEM. The statistical significance is indicated by * p<0.05, ** p<0.01, (two-tailed t test)., (D) Representative LV sections depicting cardiac myocyte diameters (scale bar 100 µm).


