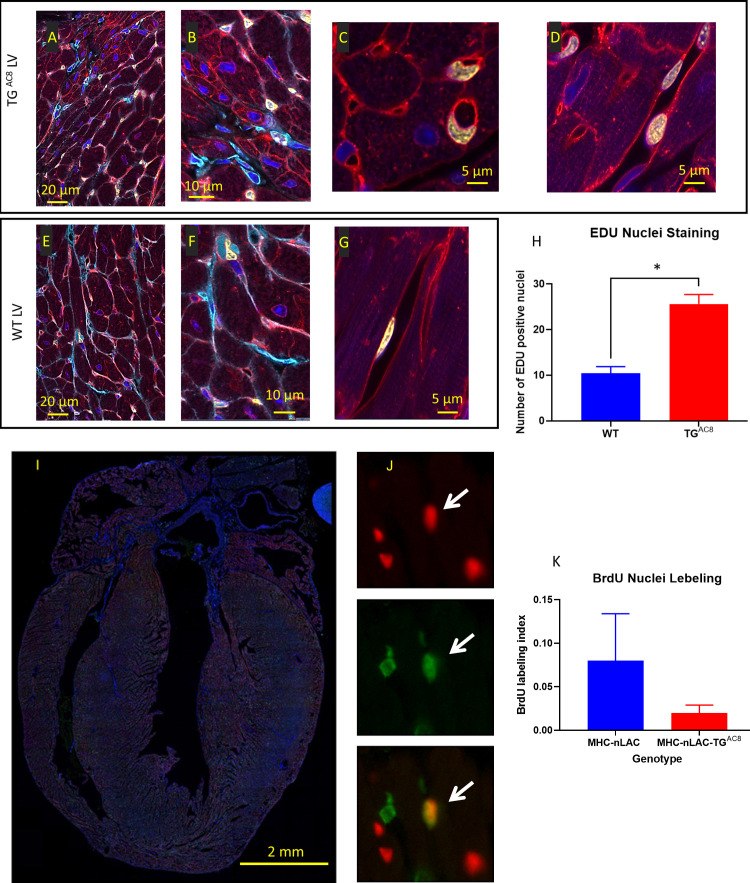
Figure 3. EdU labeling of cardiac tissue.
(A–G) representative examples of confocal images (400 x) of LV WGA (red), vimentin (Cyan), EdU (yellow), DAPI (blue), (H) average number of EdU-labeled nuclei positive field counts in LV TGAC8 vs WT (N=3 mice in each genotype). Data are presented as Mean± SEM. The statistical significance is indicated by * p<0.05, (t test). Detection of cardiomyocyte S-phase activity. (I) Section from the heart of a TGAC8, MHC-nLAC double-transgenic mouse subjected to 12 days of BrdU treatment. The section was processed for β-galactosidase (to identify cardiomyocyte nuclei, red signal) and BrdU (to identify DNA synthesis, green signal) immune reactivity, and then counterstained with Hoechst (which stains all nuclei, blue signal). (J) Example of an S-phase cardiomyocyte nucleus detected with this assay. The upper panel shows β-galactosidase immune reactivity (red channel), the middle panel shows BrdU immune reactivity (green channel), and the lower panel shows a red and green color combined image of the same field. The arrow identifies an S-phase cardiomyocyte nucleus, as evidenced by the overlay of β-galactosidase and BrdU immune reactivity, which appears yellow in the color combined image. (H) Graph representing S-phase activity in the TGAC8, MHC-nLAC double-transgenic vs. the MHC-nLAC single transgenic animals (mean +/- SEM, p=0.315; 5 mice per genotype and 3 sections per mouse were analyzed).

