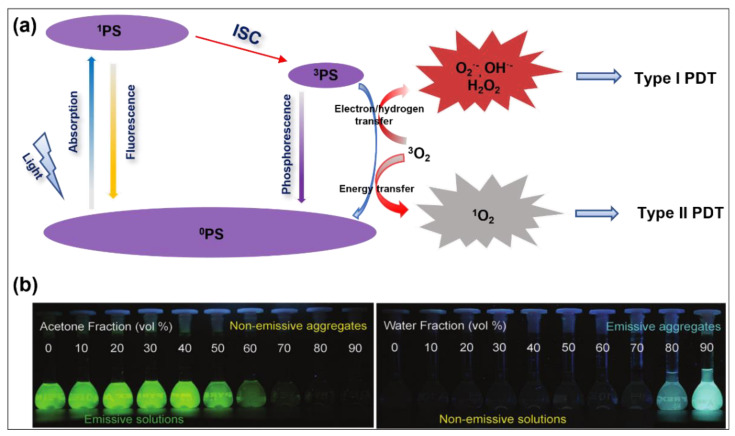
Figure 1.
(a) Schematic of a Jablonski diagram showing ROS generation processes for organic PSs. (b) Comparison of fluorescence changes of ACQ (fluorescein isothiocyanate, FITC) and AIE (tetraphenylethylene, TPE) molecules in acetone (good solvent) and water (poor solvent) mixtures with different water fractions. Reprinted with permission from [39].

