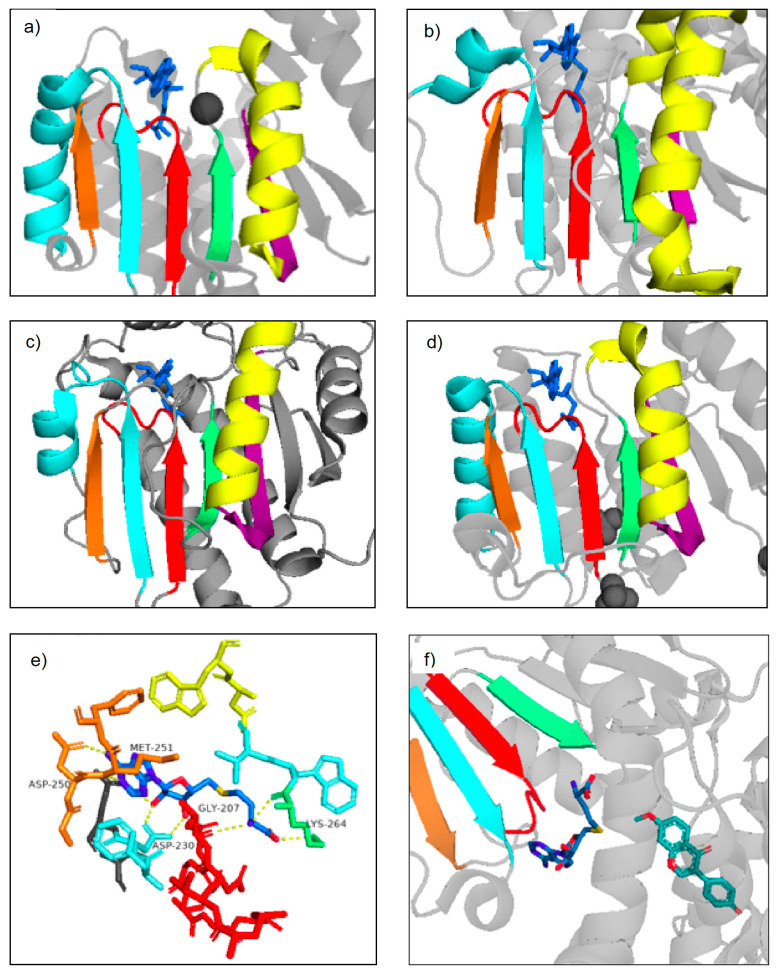
Figure 5.
Rossmann fold motifs highlighted in Class I plant NPMTs and Class I bacterial MTs. Three-dimensional visualizations were created using PDB crystal structures and PyMOL. (a) Cation-dependent, SbCCoAOMT, (b) Cation-independent MtHI4′OMT, (c) SABATH, CrLAMT, (d) bacterial Leptospira interrogans O-methyltransferase, LiOMT (PDB 2HNK), (e) closer look at the MtHI4′OMT SAM-binding pocket, with important residues and hydrogen bonding highlighted, (f) representation of the methyl transfer between SAM and MtH14′OMT. Species names and PDB numbers for the above-mentioned plant NPMTs can be found in Table 1. The colored beta sheets and alpha helices represent Motifs I-VI, which make up the characteristic MT Class I Rossmann fold. The red strand represents Motif I, the light blue strand and helix represents Motif II, the orange strand represents Motif III, the green strand represents Motif IV, the yellow helix represents Motif V, and the purple strand represents Motif VI. The darker blue structure is either SAM or its demethylated form, SAH. The lighter blue structure is the substrate.

