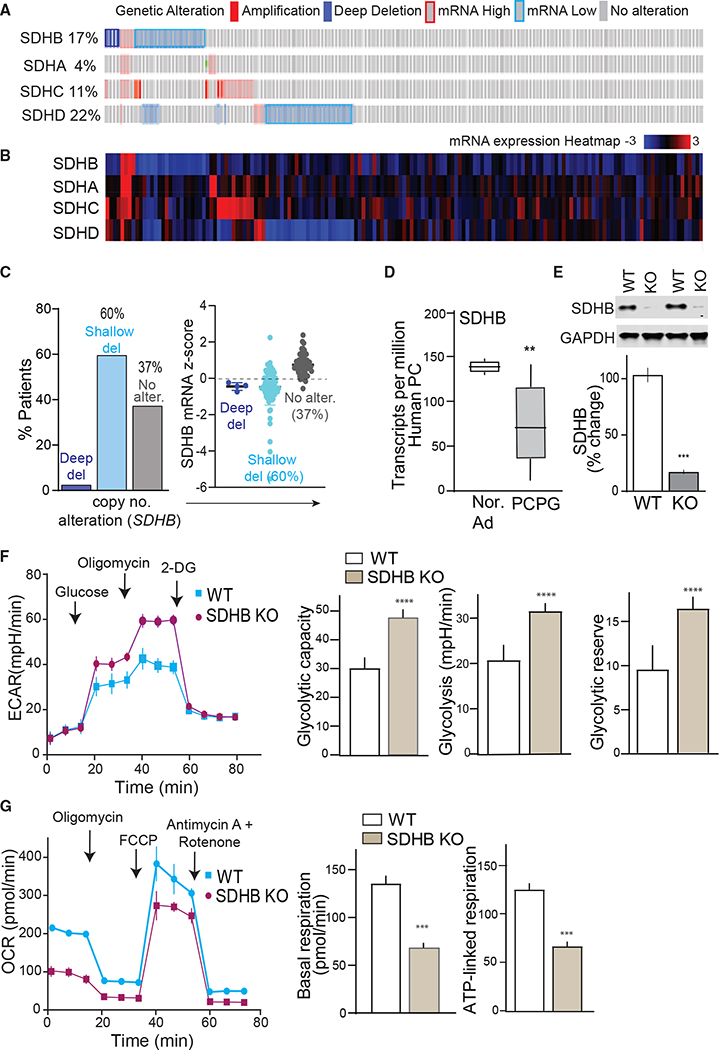
Figure 1. Alterations of SDHx genes in pheochromocytoma.
(A) Oncoprint depicts alterations in SDHx complex genes in patients. Genetic alterations are indicated by color codes.
(B) Expression heatmap of SDHx complex genes.
(C) Bar plots presenting copy number alteration and mRNA expression of SDHB in patients with PC tumors (del., deletions; alter., alterations).
(D) Boxplots of SDHB gene expression in PCPG tumors (n = 179) versus normal adrenal (n = 3).
(E) Exemplary immunoblot showing SDHB protein expression in WT versus SDHB KO hPheo1.
(F) Glycolytic profile of WT versus SDHB KO hPheo1 cells indicated as extracellular acidification rate (ECAR). Quantitative ECAR analysis indicated by glycolytic capacity, glycolysis, and glycolytic reserve.
(G) Oxygen consumption rate (OCR) measured in WT and SDHB KO cells. Bar plots show OCR analysis indicated as basal and ATP-linked respiration, n = 3, 10 replicates per group. Values are means ± SEM, ***p < 0.001, ****p < 0.0001 compared by Student’s t test.

