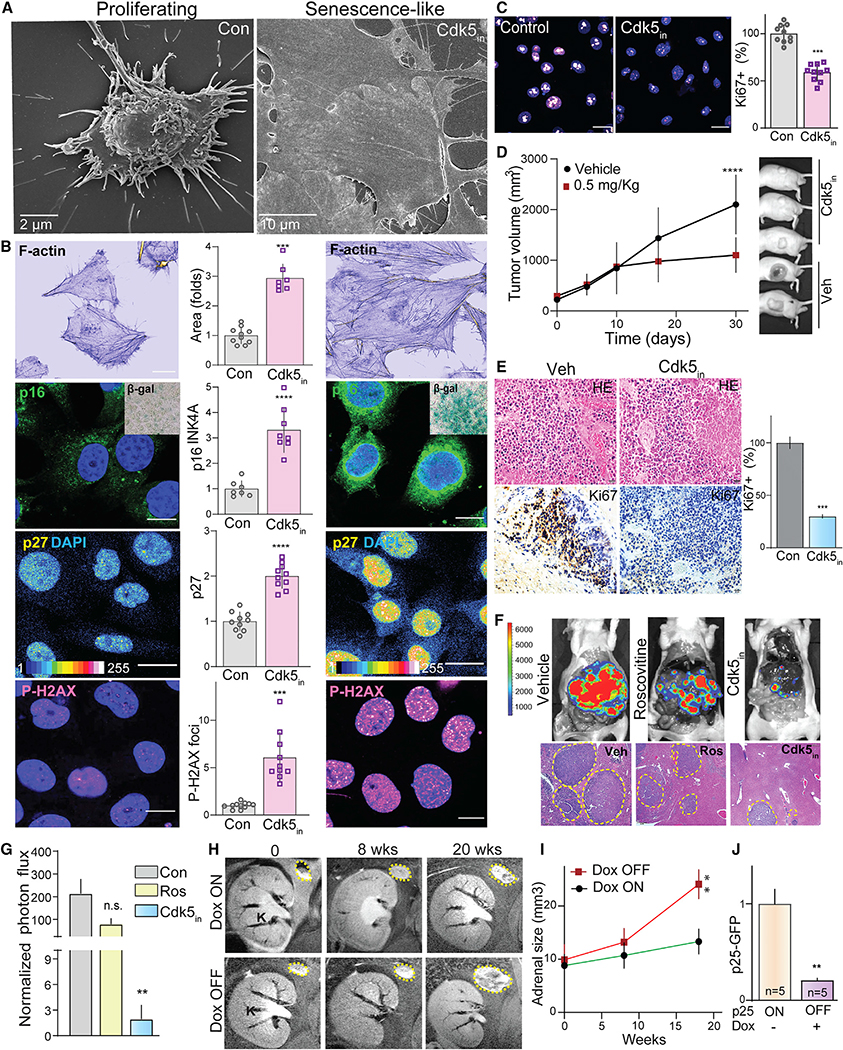
Figure 7. Cdk5in induces senescence-like phenotypic characteristics.
(A) Scanning electron microscopic images of hPheo1 cell morphology in control versus Cdk5in (Indolinone A).
(B) Imaging of proliferating cells and those treated with Cdk5in (20 nM, 48 h) for common senescence markers. Representative confocal photomicrographs and quantitation show phalloidin stain of F-actin, p16INK4a (inset is senescence-associated β-gal), p27Kip, and P-H2AX, respectively; scale bar, 136 μm.
(C) Confocal images of Ki67 staining and bar graph show percentage of Ki67-positive cells.
(D and E) SDHB KO xenografts treated with vehicle (Con, n = 8) or Cdk5in (n = 10) (0.5 mg/kg) were analyzed for tumor volume (D), followed by histological (HE) and Ki67 expression analysis in xenograft tissues (E).
(F and G) Efficacy of Cdk5 inhibition tested on a metastatic allograft PC model, examined via in vivo bioluminescent imaging. Representative images of vivisected liver and tumor spread indicated by histological analysis and photon flux quantitation; n = 4.
(H and I) Representative coronal MRI images and quantitation showing changes in adrenal gland size of mice over time under Dox-ON/OFF conditions.
(J) Quantitation of p25GFP expression determined by immunoblotting.

