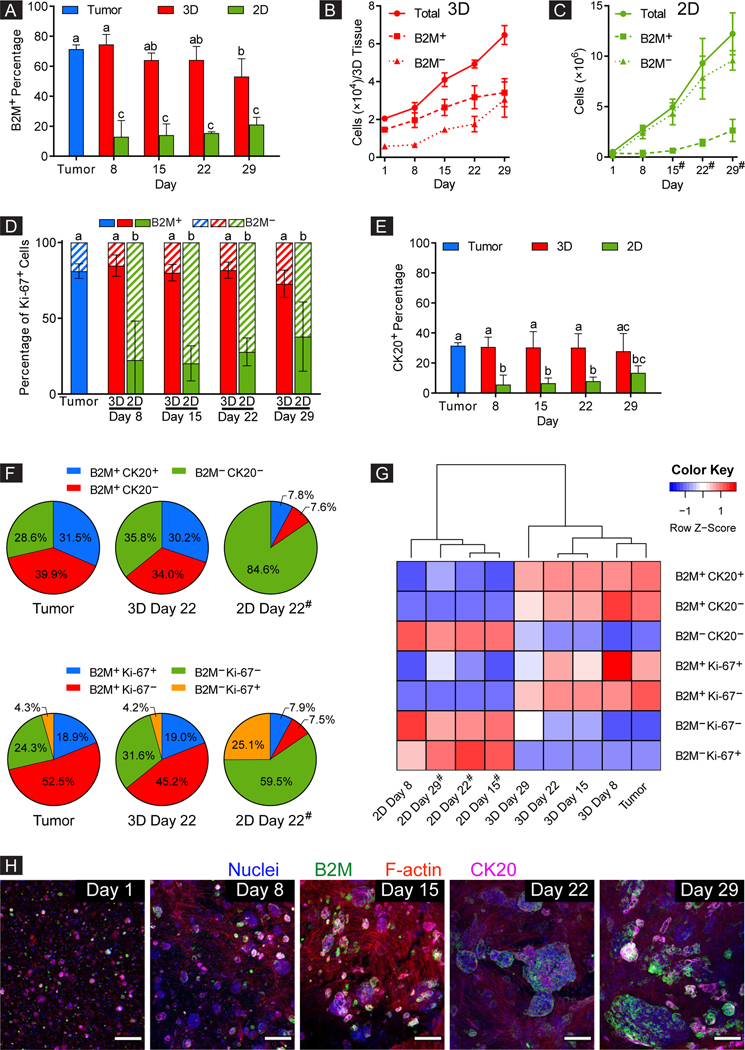
Figure 3. 3D-eCRC-PDX tissues maintained the CRC-PDX tumor cell subpopulations during long-term culture, whereas the 2D-CRC-PDX cells did not.
(A) Percentage of human (B2M+) cells within the 3D-eCRC-PDX tissues remained constant during long-term culture (through Day 22), maintaining the originating CRC-PDX tumor composition. However, for 2D-CRC-PDX cells, the percentage of human cells decreased by over 80% after 8 days of culture. While the cell numbers increased over time, (B) the 3D-eCRC-PDX tissues maintained similar ratios of human cancer and mouse stromal cells to those of the originating CRC-PDX tumor, whereas in (C) 2D-CRC-PDX culture, mouse (B2M−) cells outgrew the human cells. The 3D-eCRC-PDX tissues maintained the percentages of (D) human proliferative (B2M+ Ki67+) and (E) CK20+ cells over 29 days of culture, whereas in 2D-CRC-PDX cultures these percentages decreased significantly after 8 days of culture and remained low thereafter. (F) In sharp contrast to the 2D-CRC-PDX cultures, cell subpopulations within the 3D-eCRC-PDX tissues were similar to the originating CRC-PDX tumors. (G) The 3D-eCRC-PDX tissue cell subpopulations clustered with the CRC-PDX tumors whereas the 2D-CRC-PDX cells clustered separately from both the 3D-eCRC-PDX tissues and CRC-PDX tumors. (H) Colony-forming cells within the 3DeCRC-PDX tissues were all B2M+ and partially CK20+, thereby being human cells. Conversely, the elongated cells were neither B2M+ nor CK20+, thereby being mouse stromal cells (scale bar = 200 μm). Data are mean ± SD. Means that do not share a letter are significantly different (p ≤ 0.05, n = 3 separate batches of cell culture). # indicates that the 2D-CRC-PDX cells were passaged at the previous time point.

