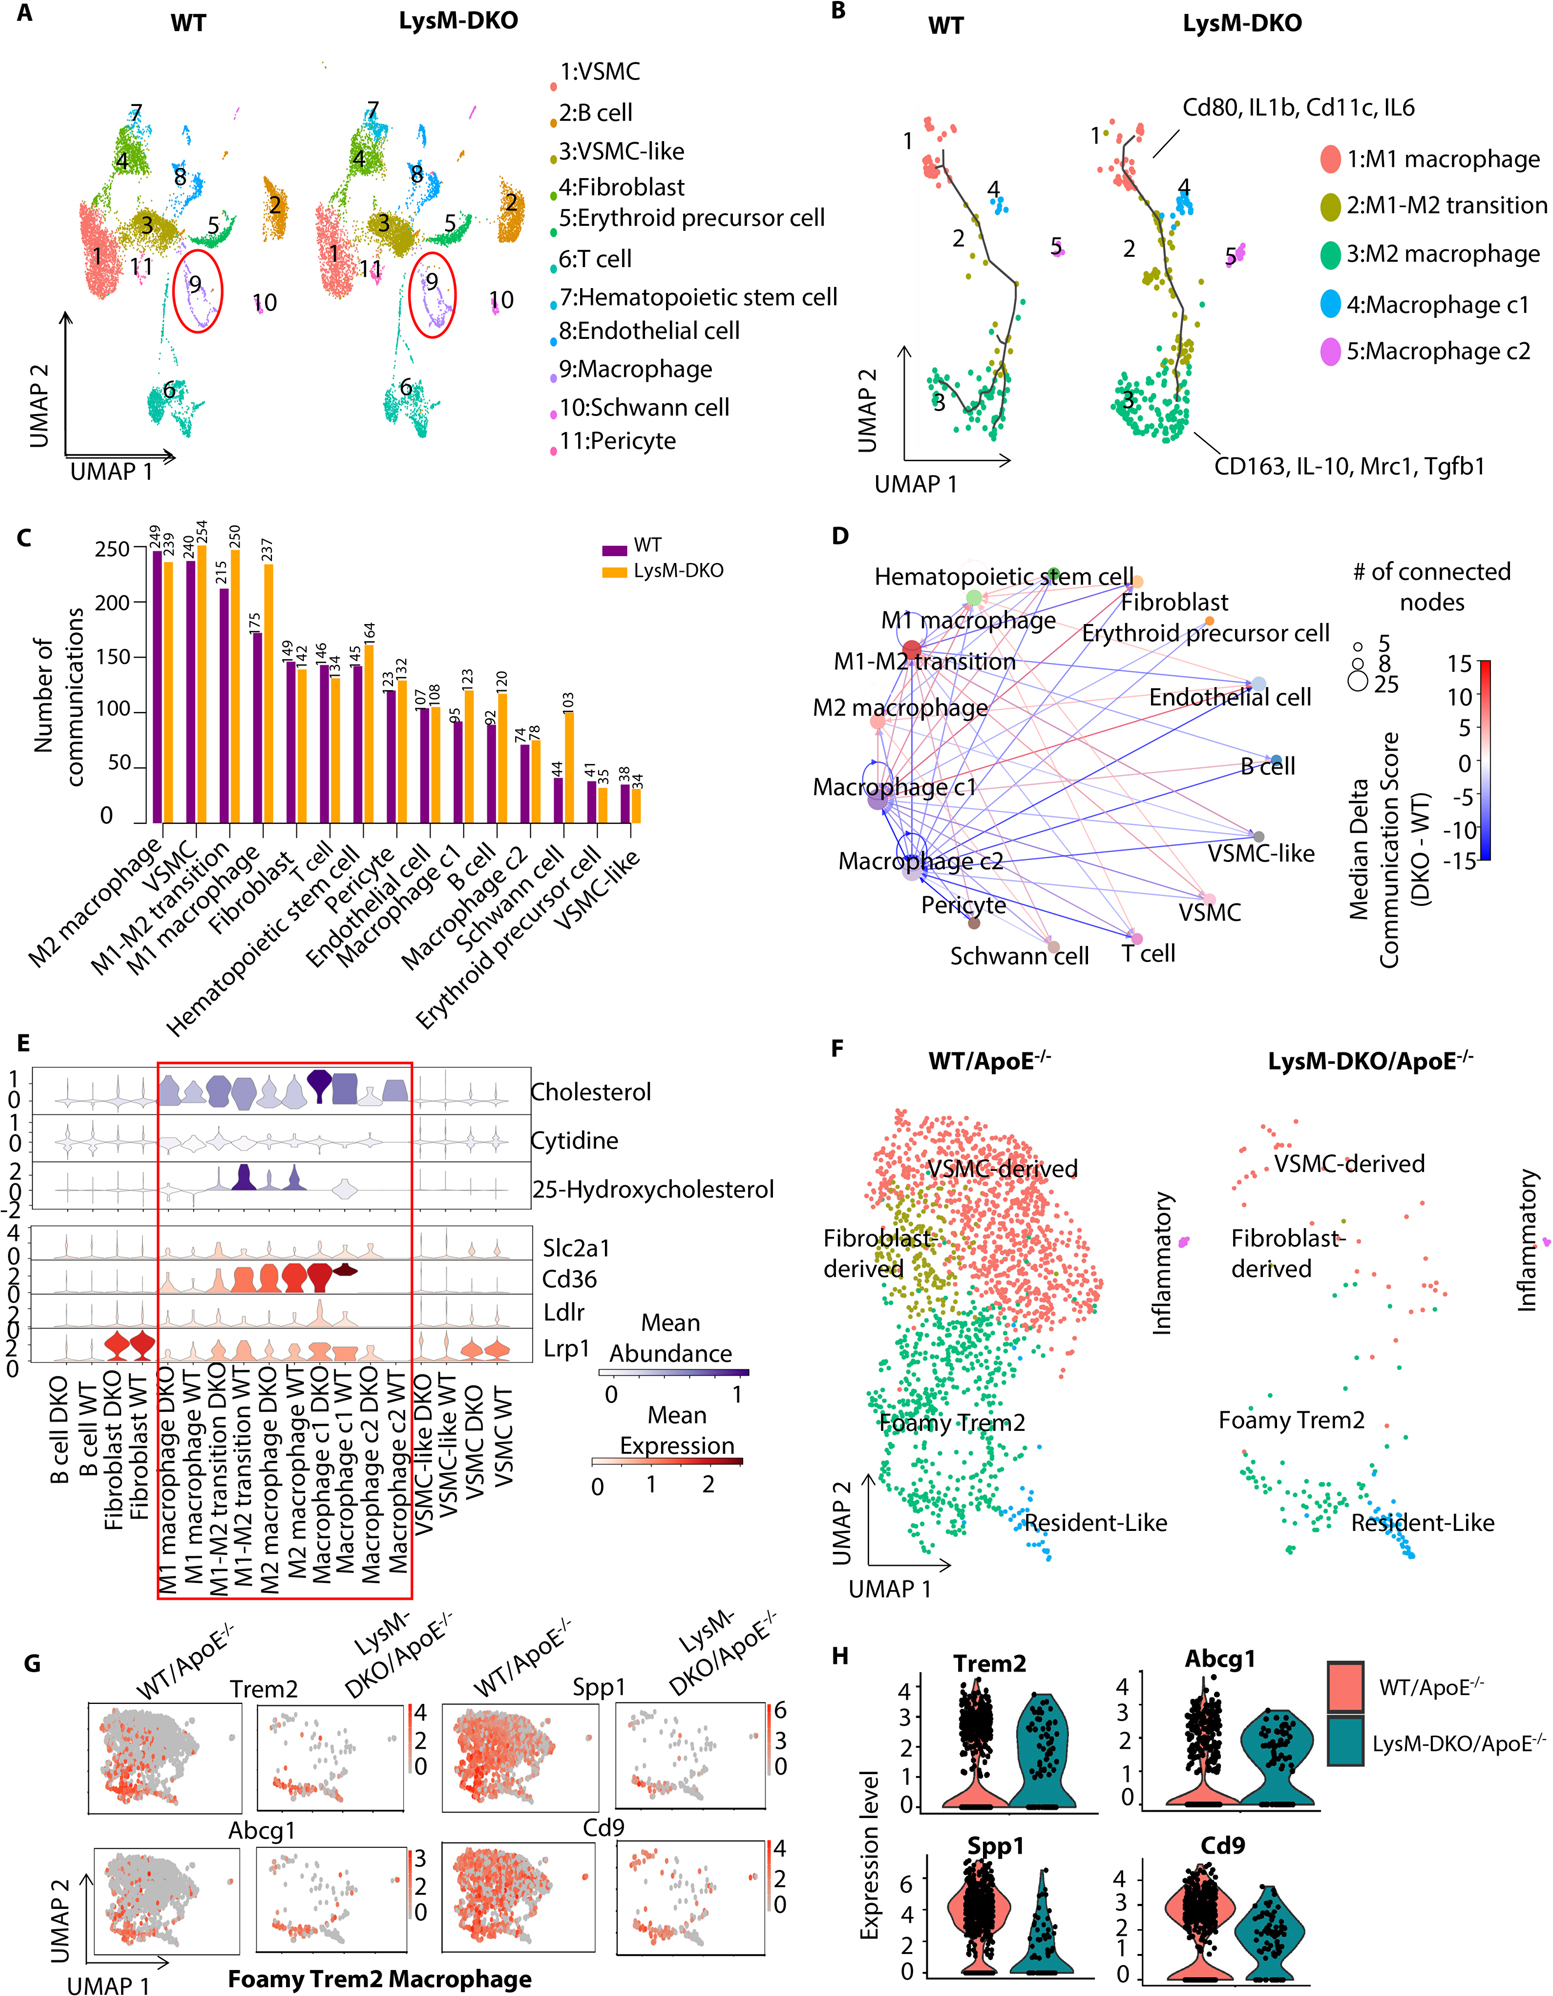
Figure 1. scRNA-seq data revealed down-regulation of cholesterol-related cell-cell communications mediated by metabolites and their sensor proteins in macrophage subpopulations in LysM-DKO aorta compared to WT.

Aortas from WT and LysM-DKO mice (n=3 mice/each group) were isolated, digested and mixed for scRNA sequencing. (A) UMAP plot of cell clusters in aortas from WT and LysM-DKO mice on normal diet. Macrophage populations are indicated in the red circle. (B) UMAP of subclusters of major macrophage populations in (A). Trajectory inferred by Monocle3 was displayed. (C) A bar plot showing the number of communication events in cell groups in WT and LysM-DKO. (D) A circle plot showing the differential communications between cell groups in LysM-DKO compared to WT. The arrows indicate directions of communication from sender cells to receiver cells. The size of nodes positively correlates with the number of connected nodes. Line colors indicate the difference in communication scores of LysM-DKO compared to WT. (E) Violin plots of the abundance of representative metabolites and sensors across cell types in WT and LysM-DKO. Metabolite abundance (upper), sensor abundance (below). (F) ScRNA-seq identified the different macrophage subpopulations in aortas from WT/ApoE−/− and LysM-DKO/ApoE−/− mice on Western diet for 16 weeks. UMAP plot of each macrophage subpopulation in WT/ApoE−/− and LysM-DKO/ApoE−/−. (G-H) Feature plots (G) and Violin plots (H) showing the global expression level of marker genes in the macrophage sub types (e.g., Foamy Trem2 macrophage).
