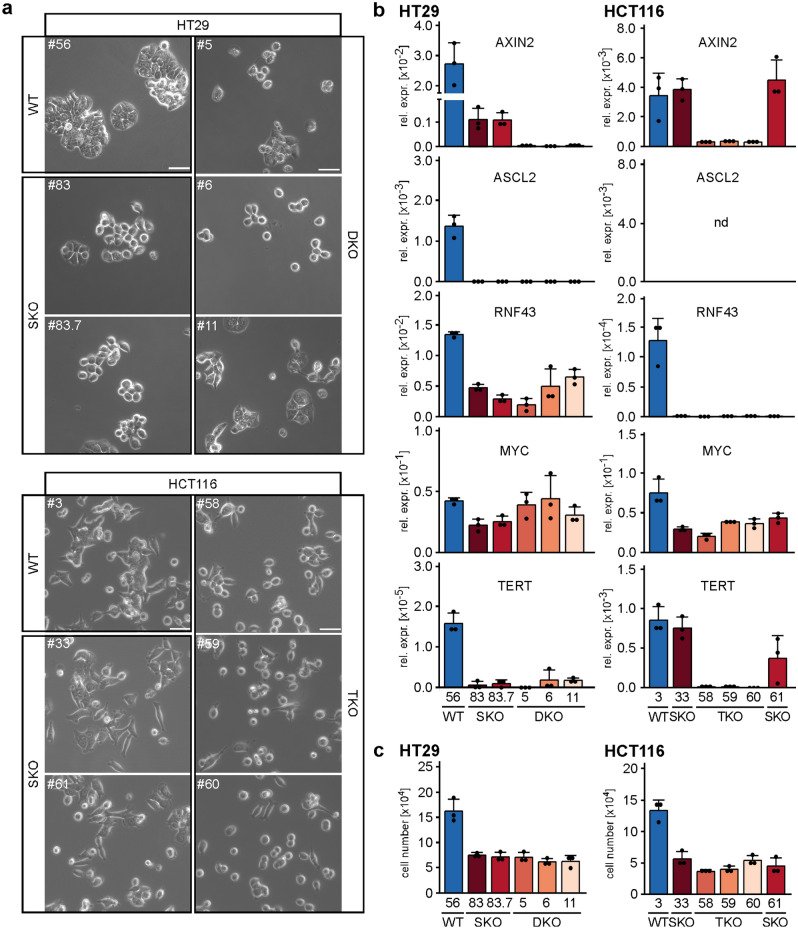
Figure 2.
Redundant and non-redundant functions of TCF/LEF family members in HT29 and HCT116 CRC cell lines. (a) Representative micrographs from one of three independent biological replicates showing the morphology of HT29 and HCT116 WT, SKO, DKO, and TKO cells 24 h after seeding the same starting numbers of cells. The scale bars represent 50 µm. (b) Expression of the WNT/β-CATENIN target genes AXIN2, ASCL2, RNF43, MYC, and TERT was analyzed by qRT-PCR in HT29 and HCT116 cell clones with the genotypes indicated. Transcript levels were normalized to those of GAPDH, and are displayed as relative expression (rel. expr.). The bar plots summarize the expression data; error bars indicate SD (n = 3). Each dot represents an individual measurement. nd not detectable. (c) To compare population dynamics of WT and TCF/LEF-deficient cells, 5 × 10⁴ HT29 and HCT116 cells with the genotypes indicated were seeded, incubated for 72 h and counted. The resulting cell counts are displayed as bar plots with each dot representing an individual measurement. Error bars indicate SD (n = 3). (b,c) Statistical significance of differences in gene expression levels and cell numbers was not analyzed for this series of experiments due to different group sizes of WT, SKO, DKO and TKO cell clones (see “Methods”).

