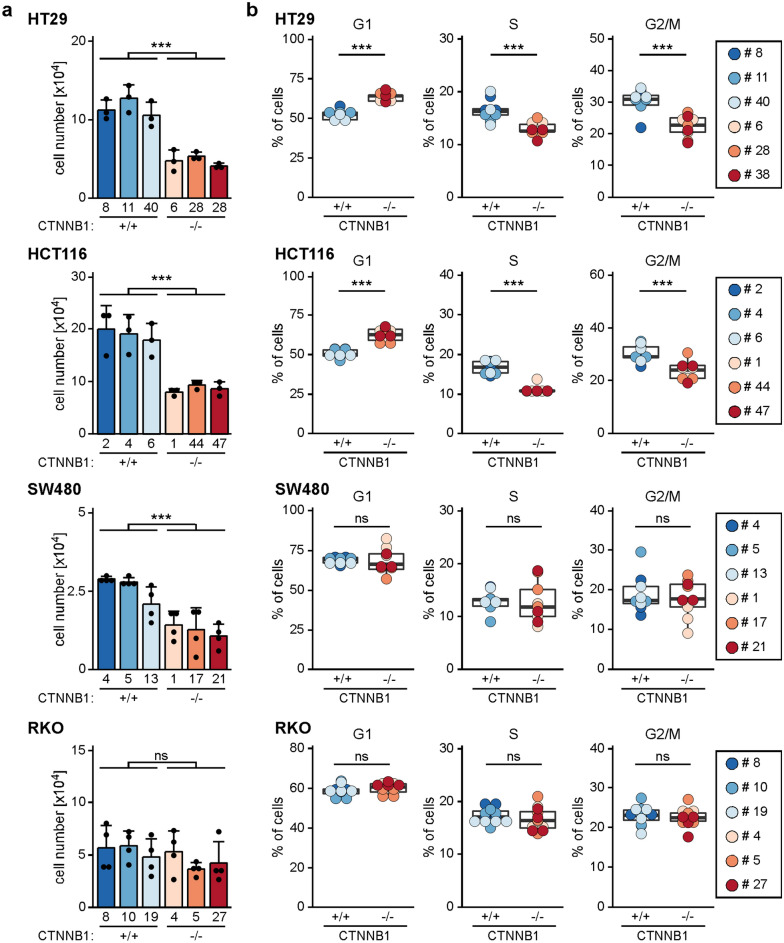
Figure 5.
Cell-type-specific impairment of population dynamics and cell cycle progression upon loss of β-CATENIN. (a) To compare population dynamics of WT and β-CATENIN-deficient cells, 1 × 10⁴ each of HT29, HCT116, SW480, and RKO cells with the genotypes indicated were seeded, incubated for 72 h, and counted. The resulting cell counts are displayed as bar plots whereby each dot represents an individual measurement. For statistical analysis LMM was performed, the error bars indicate SD (n = 3). ns not significant. (b) To analyze differences in cell cycle distribution, HT29, HCT116, SW480, and RKO cells with the genotypes indicated were stained with propidium iodide and analyzed by flow cytometry. The proportions of cells in different cell cycle phases are depicted by box plots. Each dot represents a separate measurement with dot color identifying individual clones. For statistical analysis LMM was performed (n = 3). ns not significant.

