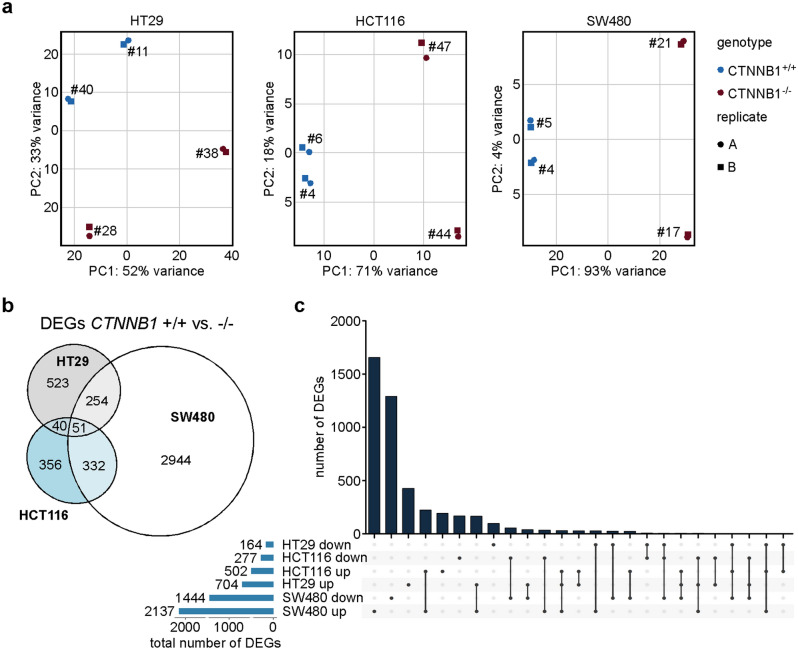
Figure 6.
Loss of CTNNB1 results in highly cell-type-specific gene expression changes in CRC cell lines. (a) Principal component analysis (PCA) of transcriptome data derived from HT29, HCT116, and SW480 cell clones with biallelic WT and mutant CTNNB1 genes. For each cell line and genotype, two different cell clones were analyzed by RNA-seq. Two independent biological replicates were performed (n = 2). (b) Venn diagram showing the numbers of differentially expressed genes (DEGs) specific and common to HCT116, HT29, and SW480 cells with biallelic WT and mutant CTNNB1 genes. (c) Upset plot depicting the numbers of DEGs specific and common to HCT116, HT29, and SW480 cells with biallelic WT and mutant CTNNB1 genes taking into account the direction of their regulation. In addition, for each cellular background the total numbers of up- and downregulated DEGs are given. (b,c) As thresholds to call DEGs, absolute values of a log2(fold change) > 1 and an adjusted p-value < 0.05 were used.

