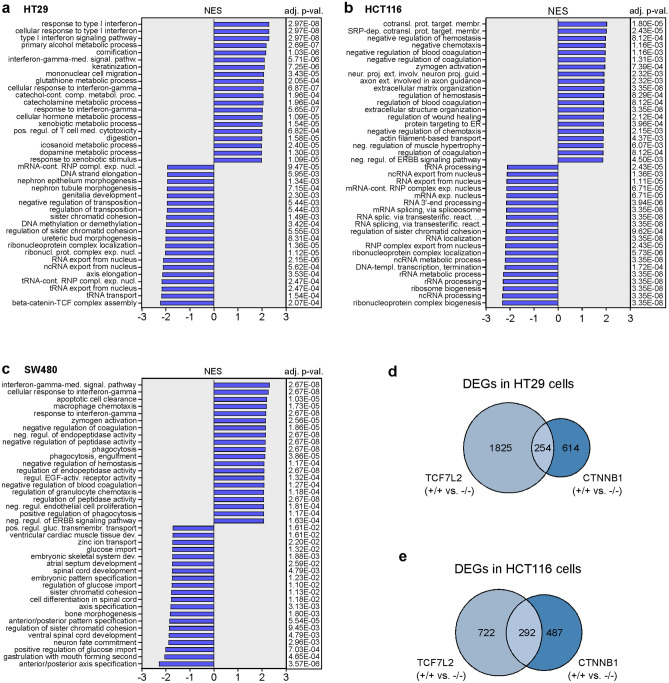
Figure 7.
Gene expression changes in β-CATENIN-deficient CRC cell lines affect cell-type-specific and cell-type-overarching biological processes. (a–c) Gene set enrichment analysis of gene sets was performed on the CTNNB1-dependent DEGs in HT29 (a), HCT116 (b) and SW480 cells (c) using Fisher’s exact test. The normalized enrichment scores (NES) and the corresponding adj. p-values for the top 20 positively- and negatively enriched Gene Ontology (GO) terms “Biological process” are shown in the bar plot. (d,e) Comparison of gene expression changes following inactivation of TCF7L2 and CTNNB1 in HT29 (d) and HCT116 cells (e). The Venn diagrams show the numbers of DEGs specific and common to cells with biallelic WT and mutant TCF7L2 or CTNNB1 genes. (d,e) As thresholds to call DEGs, absolute values of a log2(fold change) > 1 and an adjusted p-value < 0.05 were used.

