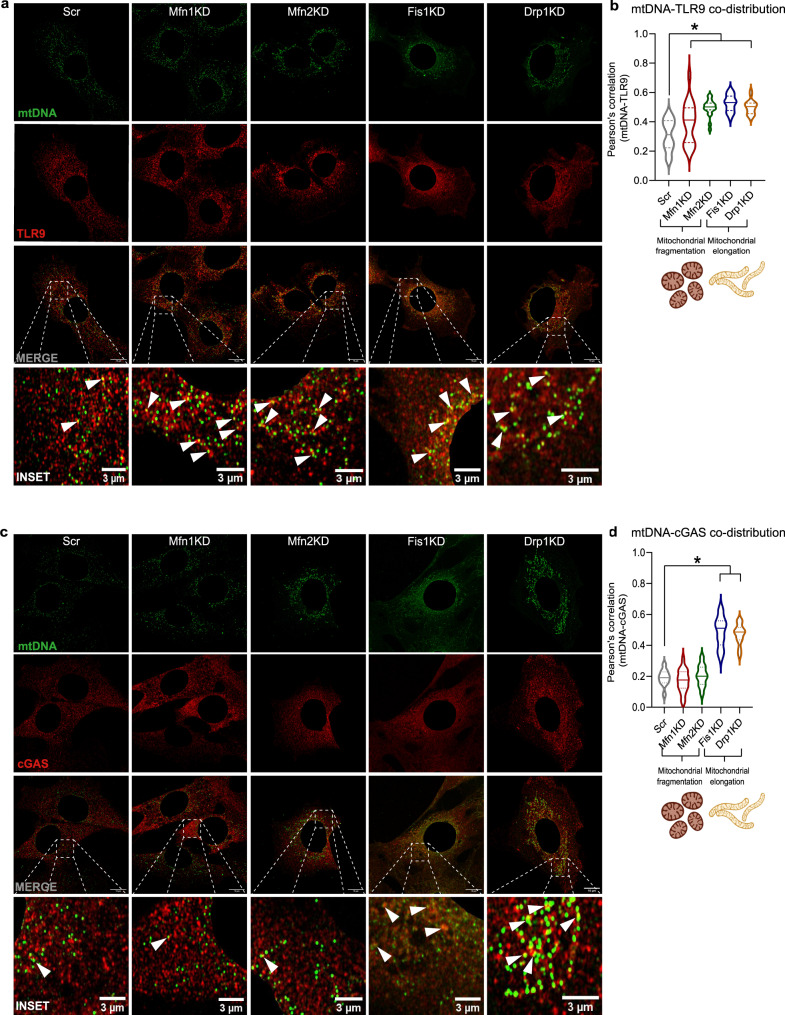
Fig. 2. Increased co-distribution between mtDNA and DNA sensors is associated with inflammation upon altered mitochondrial dynamics.
a Representative immunostainings of dsDNA (green) with subtraction of the nuclear signal (mtDNA), and TLR9 (red) in Scr, Mfn1KD, Mfn2KD, Fis1KD, and Drp1KD myoblasts. Scale bar 10 µm in MERGE and 3 µm in INSET. b Quantification of the Pearson’s correlation between mtDNA and TLR9 (n = 20 images per condition). c Representative immunostainings of dsDNA (green) with subtraction of the nuclear signal (mtDNA), and cGAS (red) in Scr, Mfn1KD, Mfn2KD, Fis1KD, and Drp1KD muscle cells. Scale bar 10 µm in MERGE and 3 µm in INSET. d Quantification of Pearson’s correlation between mtDNA and cGAS. (n = 20 images per condition). a, c White arrows point positive co-distribution. b, d Two-way ANOVA test and post-hoc t tests. Data are expressed as mean ± SEM. *p vs. Scr <0.05. b, d Created with BioRender.com. b, d Source data is provided in the Source Data File.

