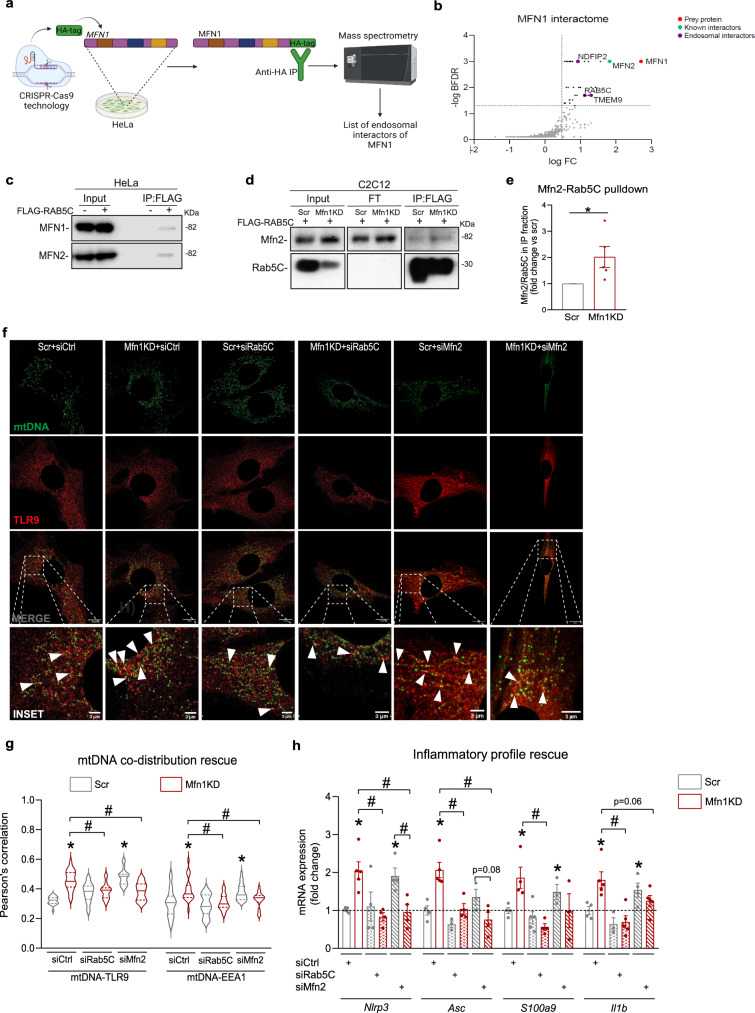
Fig. 5. Interaction between Mfn2 and Rab5C promotes mitochondria-early endosomal contacts upon Mfn1 deficiency, driving mtDNA and TLR9-dependent NFκB-mediated inflammation.
a Workflow of the generation of the MFN1-HA HeLa cell line, HA immunoprecipitation, and mass spectrometry analysis. b Graphical representation of MFN1 interacting candidates organized according to their fold change (FC) and Bayesian False Discovery Rate (BFDR). Identified in purple are the endosomal interactors of MFN1, and in green a known MFN1 interactor. c MFN1 and MFN2 representative immunoblots of immunoprecipitation (IP) in WT HeLa cells overexpressing FLAG-RAB5C (n = 6). d Mfn2 and Rab5C representative immunoblots of input, flowthrough (FT), and eluate (IP) fractions of FLAG immunoprecipitation in Scr and Mfn1KD muscle cells overexpressing FLAG-RAB5C (n = 5). e Quantification of the Mfn2/Rab5C ratio in the IP fraction (n = 5). (Representative immunostainings of dsDNA (green) with subtraction of the nuclear signal (mtDNA), and TLR9 (red) (Scale bar 10 µm in MERGE and 3 µm in INSET) upon siCtrl, siRab5C or siMfn2 transfection in Scr and Mfn1KD cells. White arrows point positive co-distribution. g Quantification of Pearson’s correlation between mtDNA and TLR9 or EEA1 upon siCtrl, siRab5C, or siMfn2 transfection in Scr and Mfn1KD cells (n = 20 images per condition). h NFκB target gene expression upon siCtrl, siRab5C, or siMfn2 transfection in Scr and Mfn1KD cells (n = 5). e Two-sided Students’ T test, g, h Two-way ANOVA test and post-hoc t tests. Data are expressed as mean of n independent experiments ± SEM.*p vs. Scr <0.05 in e; *p vs. Scr + siCtrl <0.05 and #p vs. Mfn1KD + siCtrl <0.05 in g, h. a Created with BioRender.com. c–e, g, h Source data is provided in the Source Data File.

