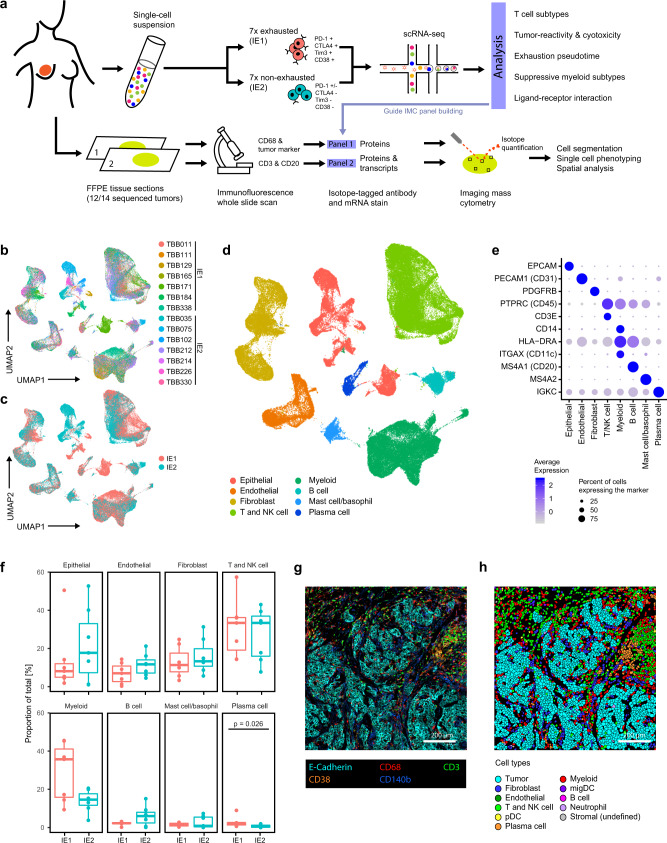
Fig. 1. Transcriptomic and spatial proteomic analysis of breast tumor immune environments.
a Sample selection and experimental approach. b UMAP plot of scRNA-seq data from all 120,000 cells colored by patient. c UMAP plot of scRNA-seq data colored by immune environment (IE). d UMAP plot of scRNA-seq data colored by cell type. e DotPlot showing transcript expression of main cell type markers in the indicated cell subsets. f Proportion (% of total cells) of main cell types in IE1 and IE2 tumors. Cell types were annotated based on marker expression in scRNA-Seq data. Two-sided Wilcoxon rank sum test was used for statistical analysis. Boxplot centers indicate the group median, boxplot bodies show interquartile ranges (IQR), and whiskers extend to the largest and the smallest value within 1.5 times the IQR above the 75th percentile and below the 25th percentile, respectively. n = 12 independent patient samples. g Exemplary IMC image showing staining patterns for the indicated markers. h Single-cell masks for the IMC image displayed in g colored by cell type. IMC staining patterns and single-cell masks were compared for all 77 images with similar results.

