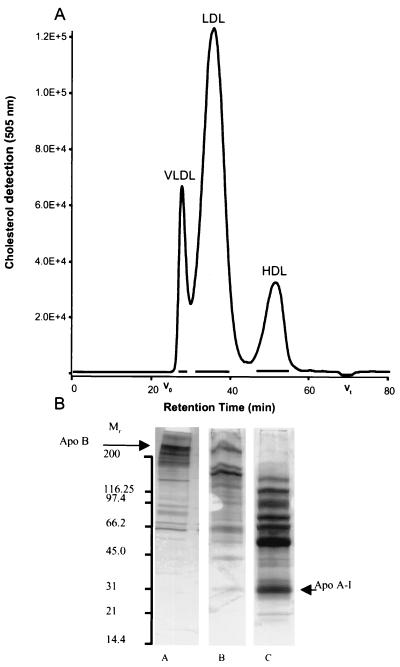
FIG. 3.
(A) Chromatographic profile of the major plasma lipoprotein classes separated by HPGC with online cholesterol detection. The average molecular masses calculated from retention characteristics were 5 MDa for VLDL, 1 MDa for LDL, and 300 kDa for HDL. Horizontal bars indicate the lipoprotein fractions pooled for further analysis. (B) SDS-PAGE analysis of these lipoprotein fractions with subsequent silver staining, showing the protein composition of the lipoproteins. M, molecular weight in thousands; lane A, VLDL; lane B, LDL; lane C, HDL. Each well was loaded with 20 μl containing a total of approximately 2 μg of protein.

